...
FLIGHT includes features that allow you to identify changes in emissions from 2010 to 2012 for individual GHG reporters that have submitted three years' years’ worth of data.
Step 1. Go to FLIGHT
...
- View all U.S. Facility Data
- View Facilities in your State
- Create a Custom Search
| Wiki Markup |
|---|
{composition-setup}{composition-setup} |
Click image to expand below 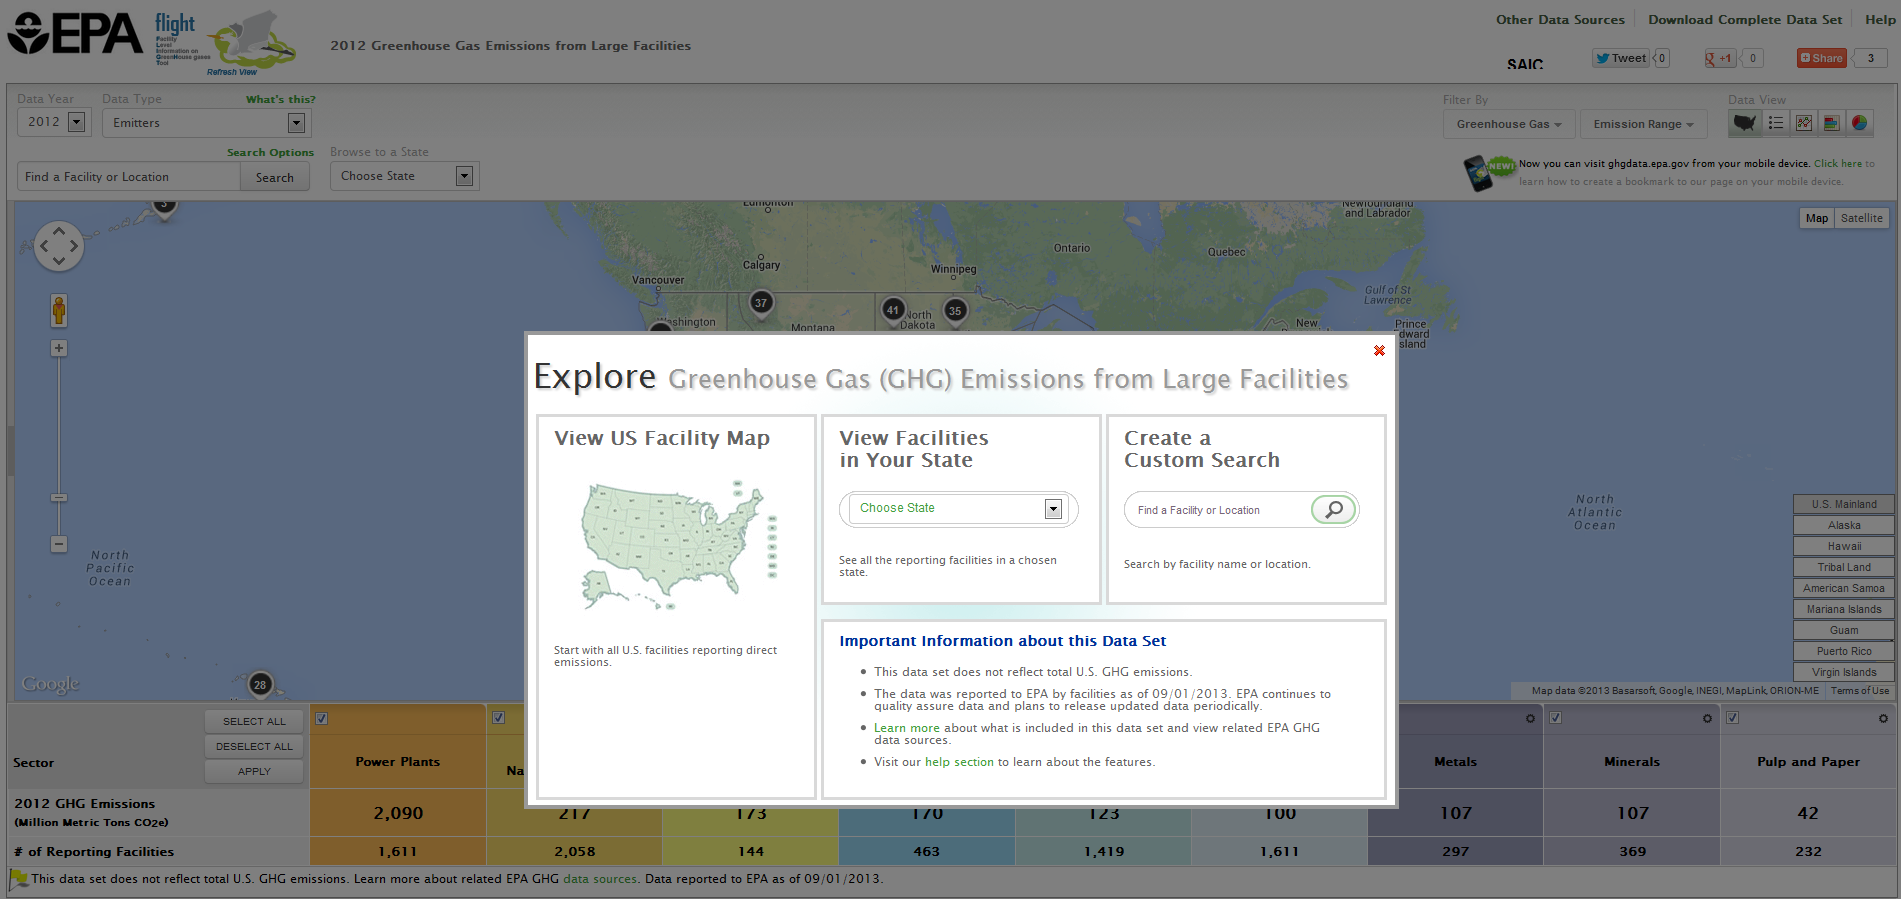
Image Added
| Wiki Markup |
|---|
{composition-setup}{composition-setup} |
Step 2. Select national search option
Click the box at the left of the popup window to View all U.S. Facility Data.
| Wiki Markup |
|---|
{composition-setup}{composition-setup} |
Click image to expand below 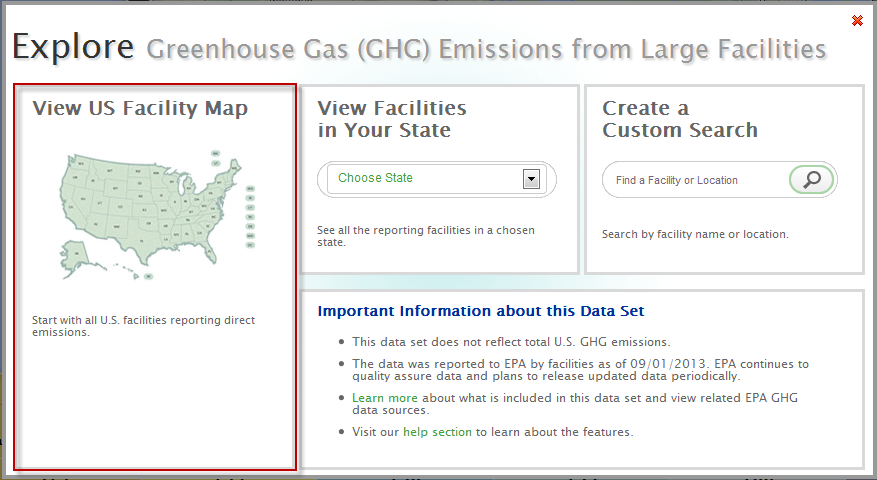
Image Added
| Wiki Markup |
|---|
{composition-setup}{composition-setup} |
composition-setup |
Step 3. Switch from Map View to List view (by facility)
Click the "List" button and the "Facility" button above the map window.
| Wiki Markup |
|---|
{composition-setup}{composition-setup} |
Click image to expand below 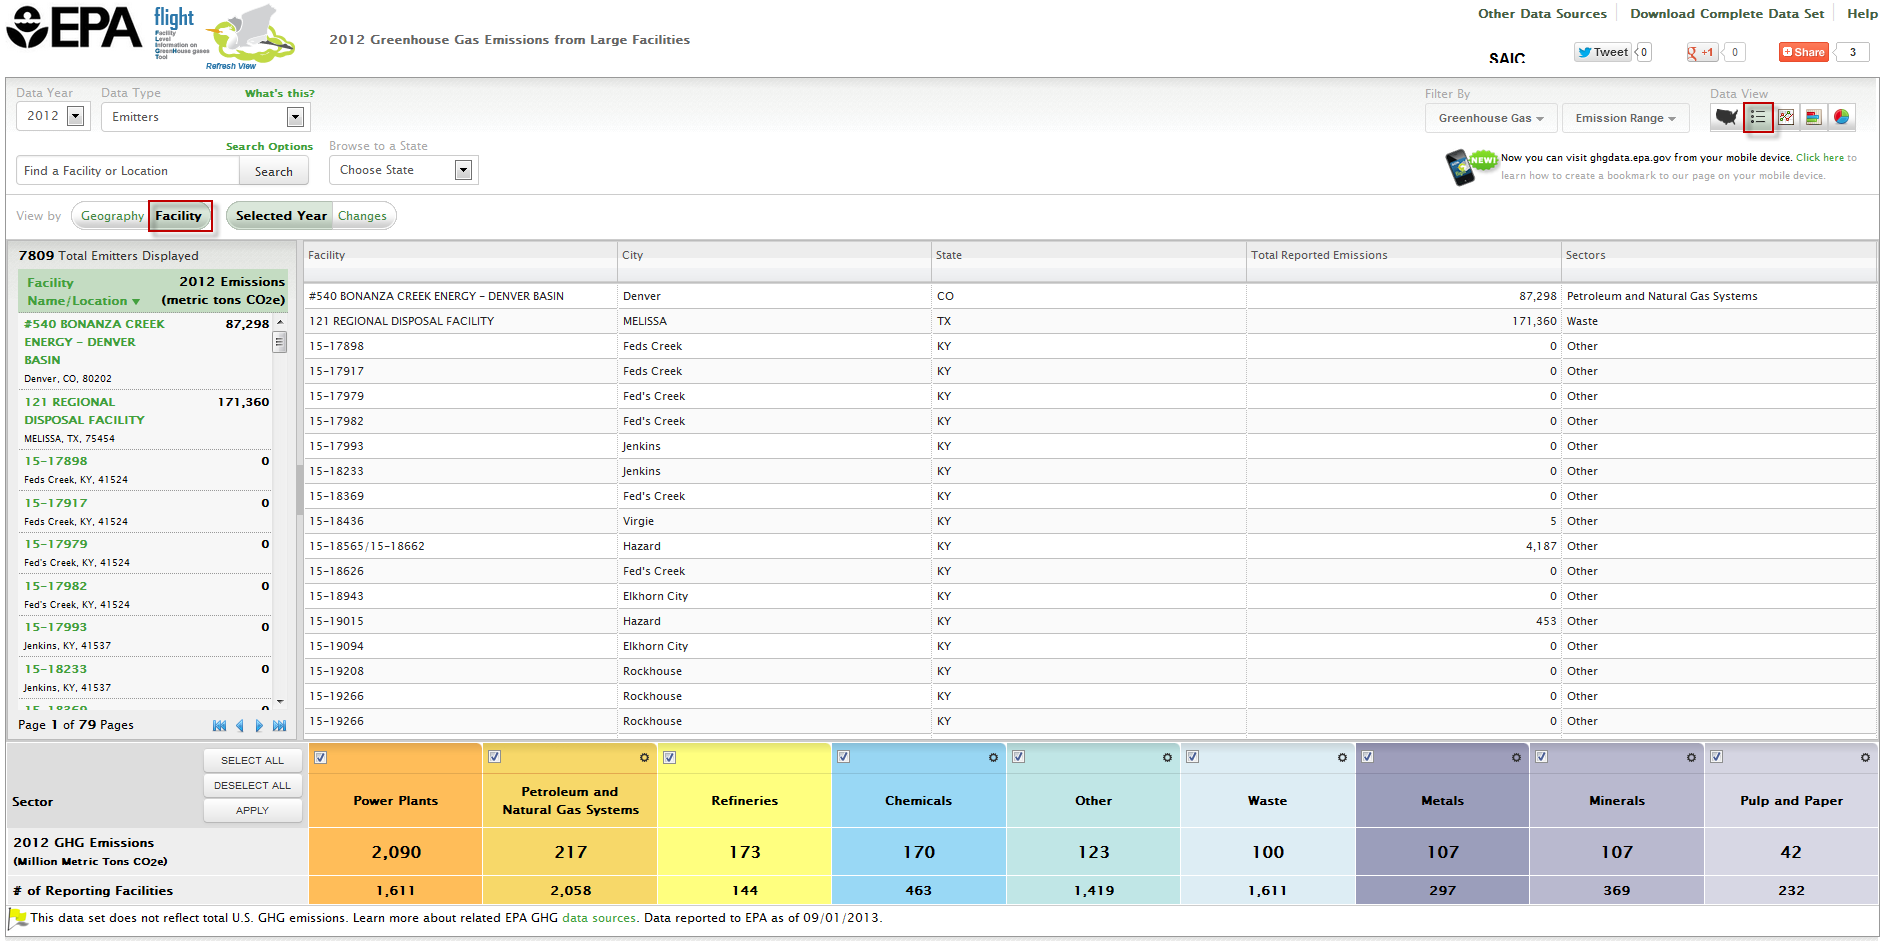
Image Added
| Wiki Markup |
|---|
{composition-setup}{composition-setup} |
Step 4. Select Changes
Click the Changes icon to display each facility's facility’s reported emissions for 2010, 2011, 2012, and the difference between these years. Please note the message that displays and 'X' ‘X’ it out when ready to view the data.
| Wiki Markup |
|---|
{composition-setup}{composition-setup} |
Click image to expand below 
Image Added
Click image to expand below 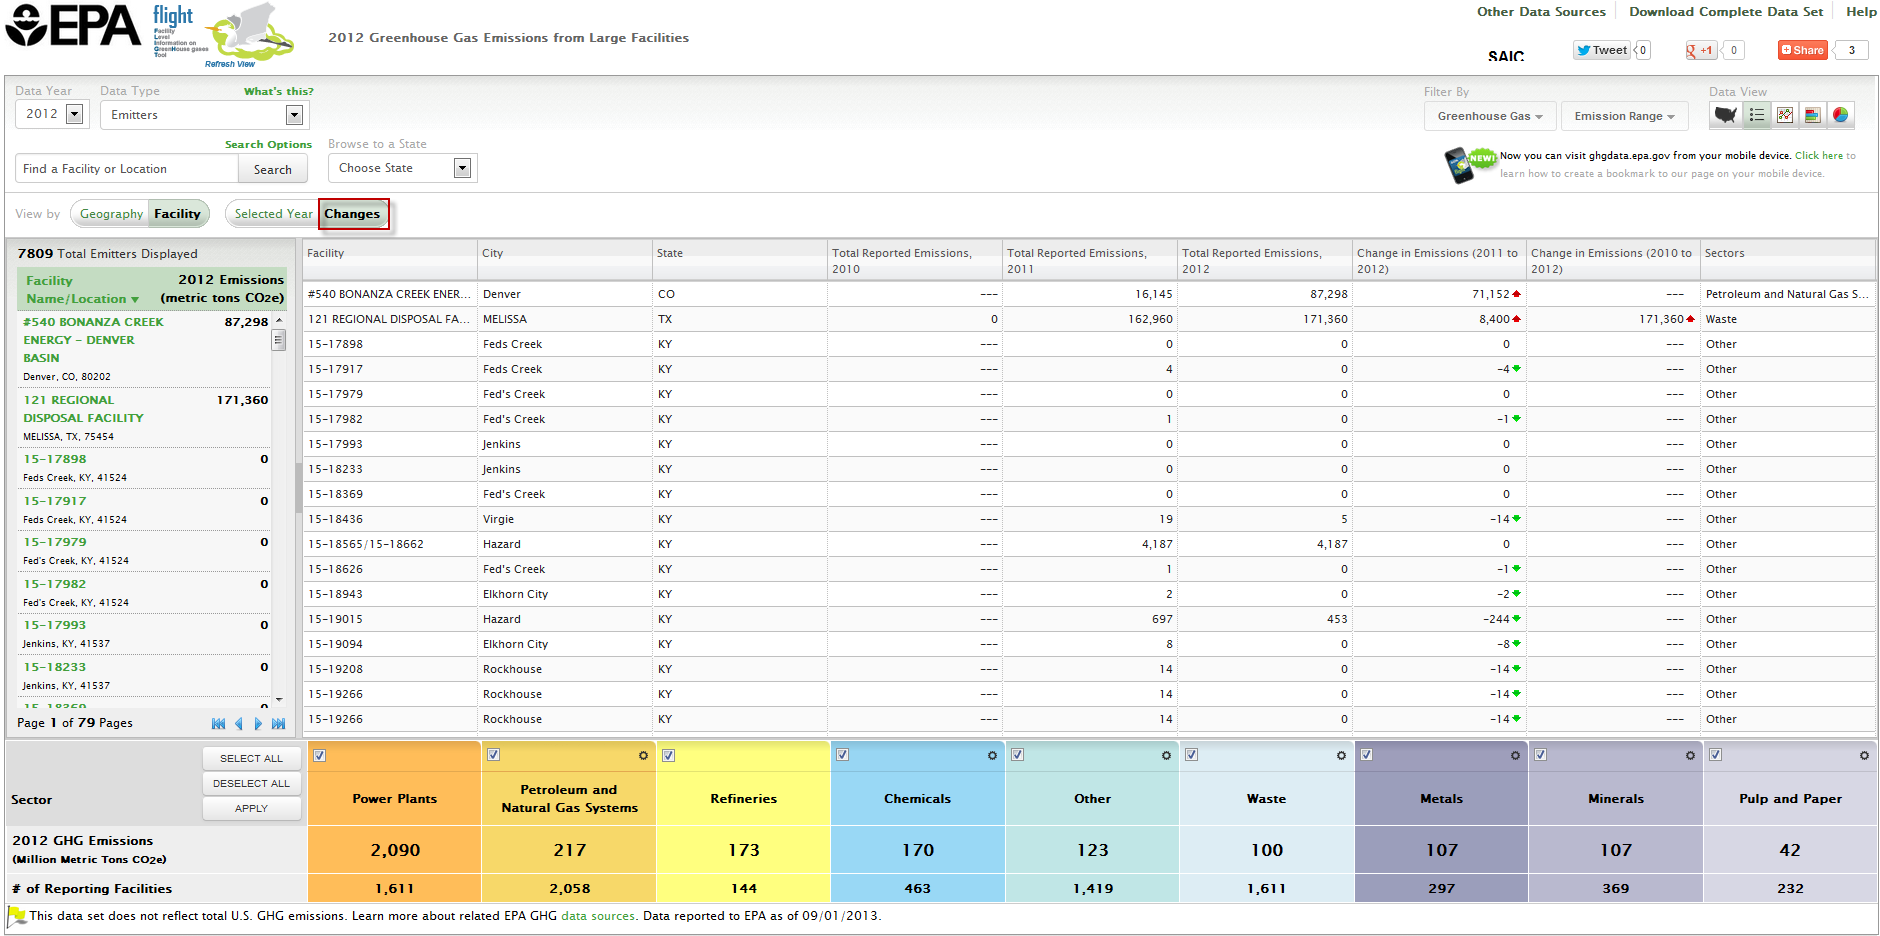
Image Added
Step 5. Sort the List
Click the Change in Emissions (2010 to 2011 or 2010 to 2012) column headers once to sort the list from highest to lowest, then click a second time to sort from lowest to highest.
Click image to expand below 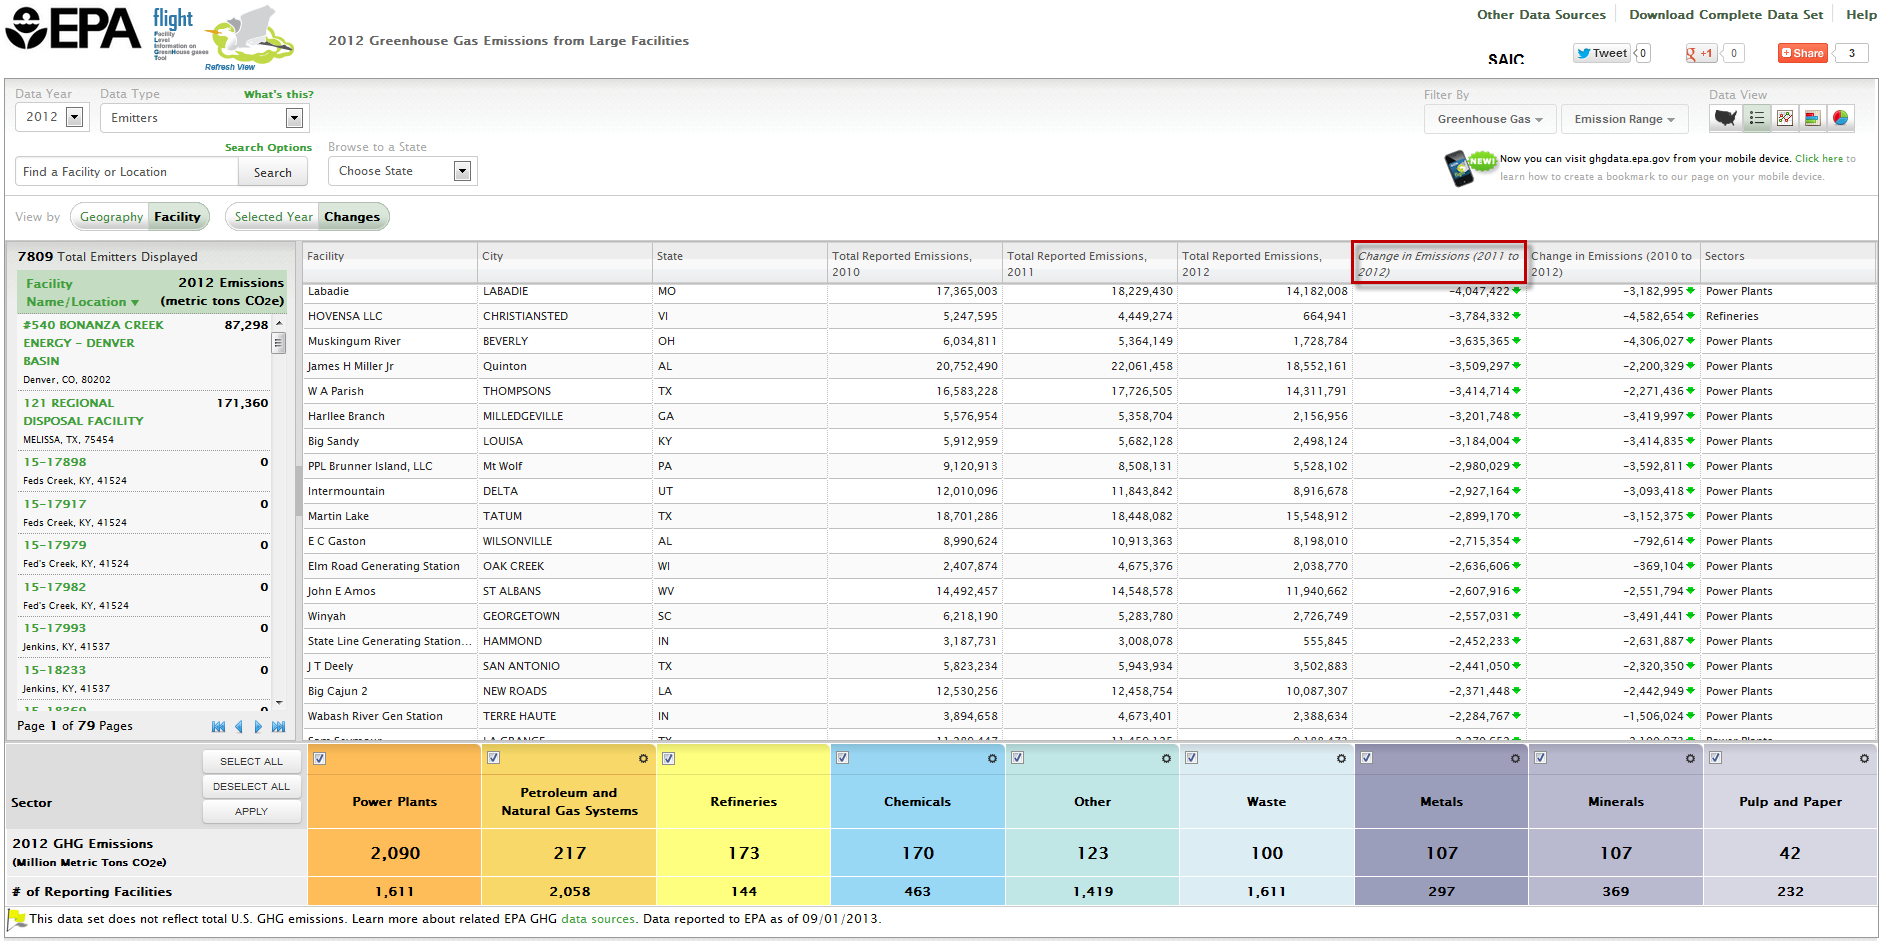
Image Added
Step 6. Identify the Facility of Interest
The facility at the top of list is the one whose emissions decreased the most in your search category.
Click image to expand below 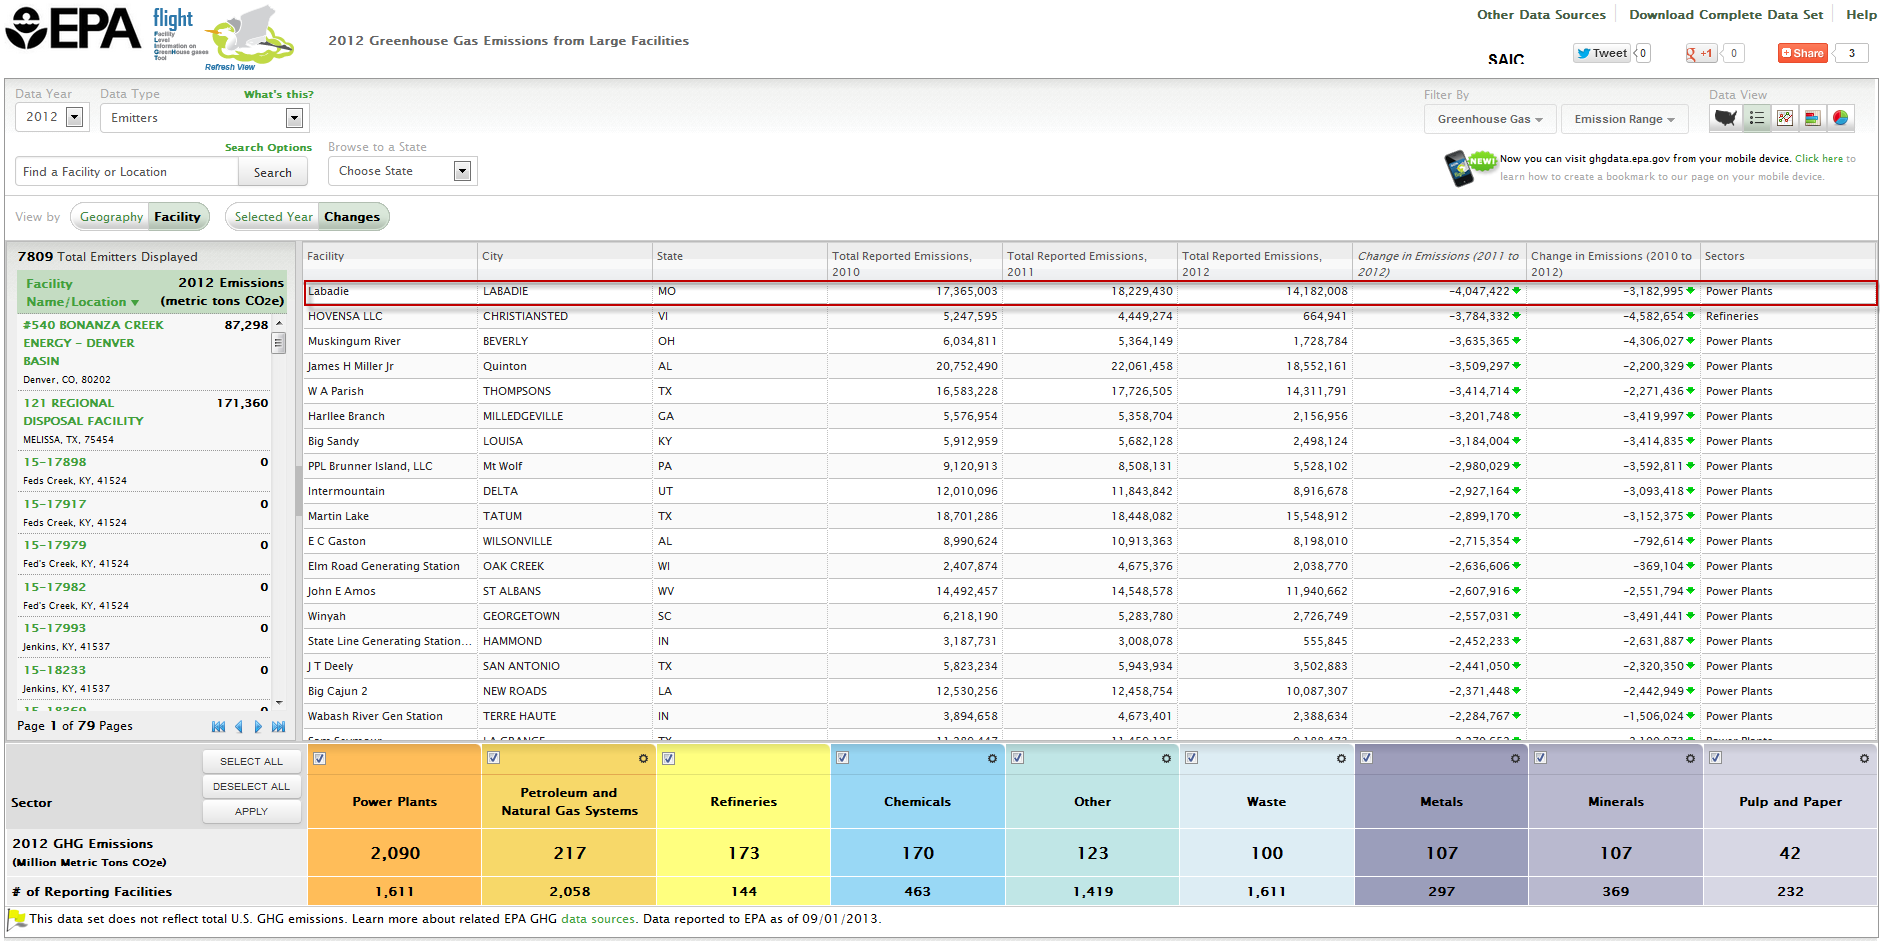
Image Added
Step 7. Select the Facility of Interest
Locate the facility on the left side list view and select it or search for the facility using the search box.
Click image to expand below 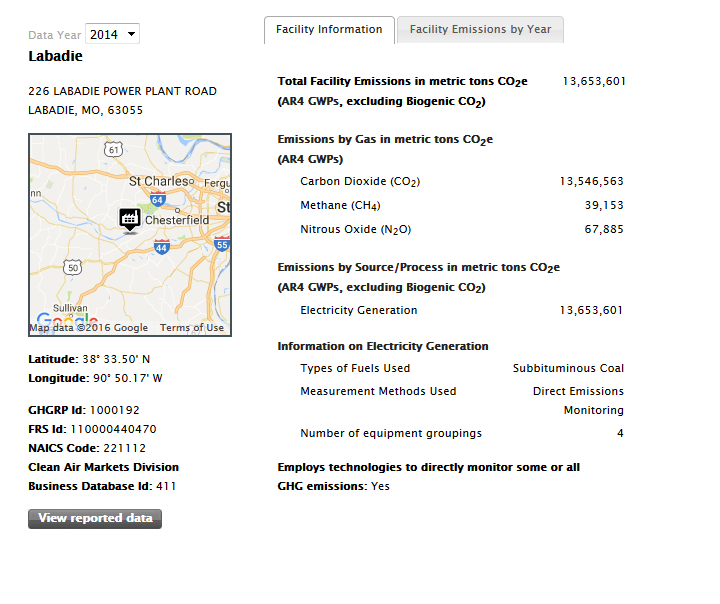
Image Added
Step 8. View Emissions Trend for the Facility
Click Facility Emissions by Year to view how this facility's facility’s emissions have changed over time.
Click image to expand below 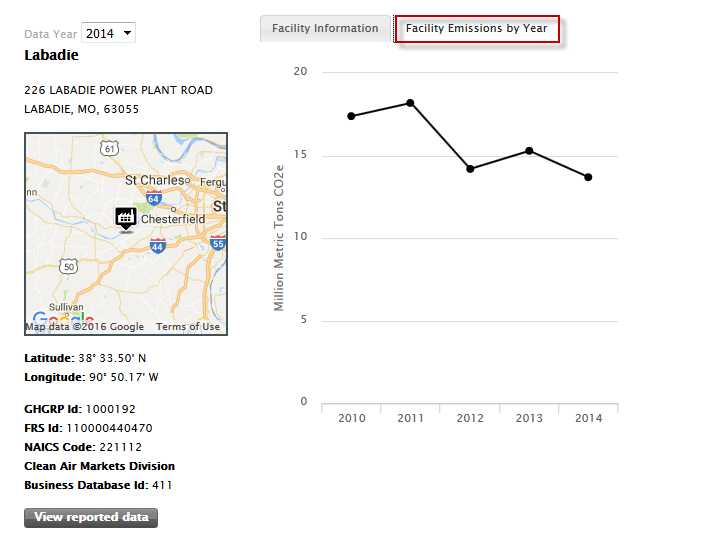
Image Added
#Back to Top