This page provides step-by-step instructions for finding information on emissions trends.
Beginning with Reporting Year 2011, 12 new source categories began reporting GHG data for the first time. EPA added those new source categories to the sectors displayed in FLIGHT's dashboard, as appropriate. Due to the inclusion of new source categories in some of the sectors, the total emissions captured by these sectors increased from 2010 to 2011. This increase did not necessarily correspond to an increase in U.S. GHG emissions from that sector, it may have been due to the increased coverage of the sector. As such, EPA does not show sector level trend data in FLIGHT for sectors that had a change in coverage from 2010 to 2011. Over time, the GHGRP will provide robust trend information for all industrial sectors. Power plants, refineries, minerals and pulp and paper had the same coverage in 2010 as 2011 and EPA has added a bar chart to FLIGHT so users can quickly visualize how emissions changed from 2010 to 2011 for these sources.
FLIGHT includes features that allow you to identify changes in emissions from 2010 to 2011 for individual GHG reporters that have submitted two years worth of data. GHG data for some source categories are not directly comparable between 2010 and 2011.
Step 1. Go to FLIGHT
When you first enter the Facility Level Information on Greenhouse Gases Tool (FLIGHT), you will be presented with two search options:
- View all U.S. Facility Data by map
- View Facilities in your State
Click image to expand below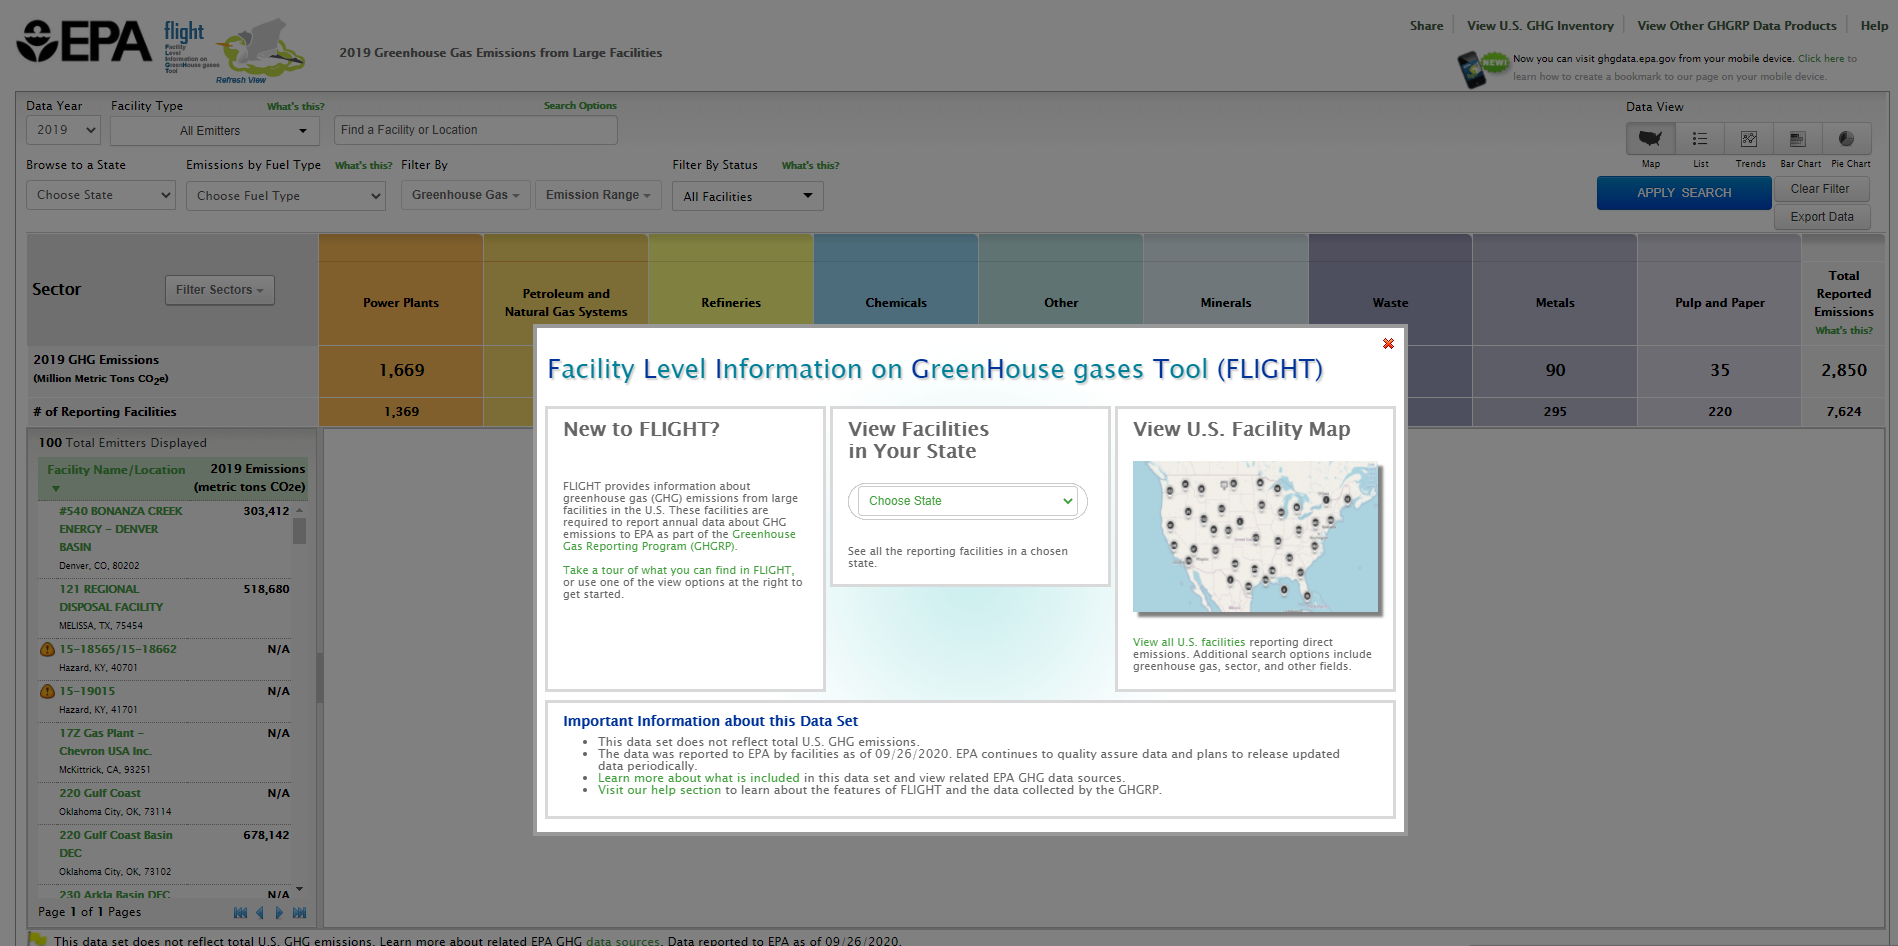

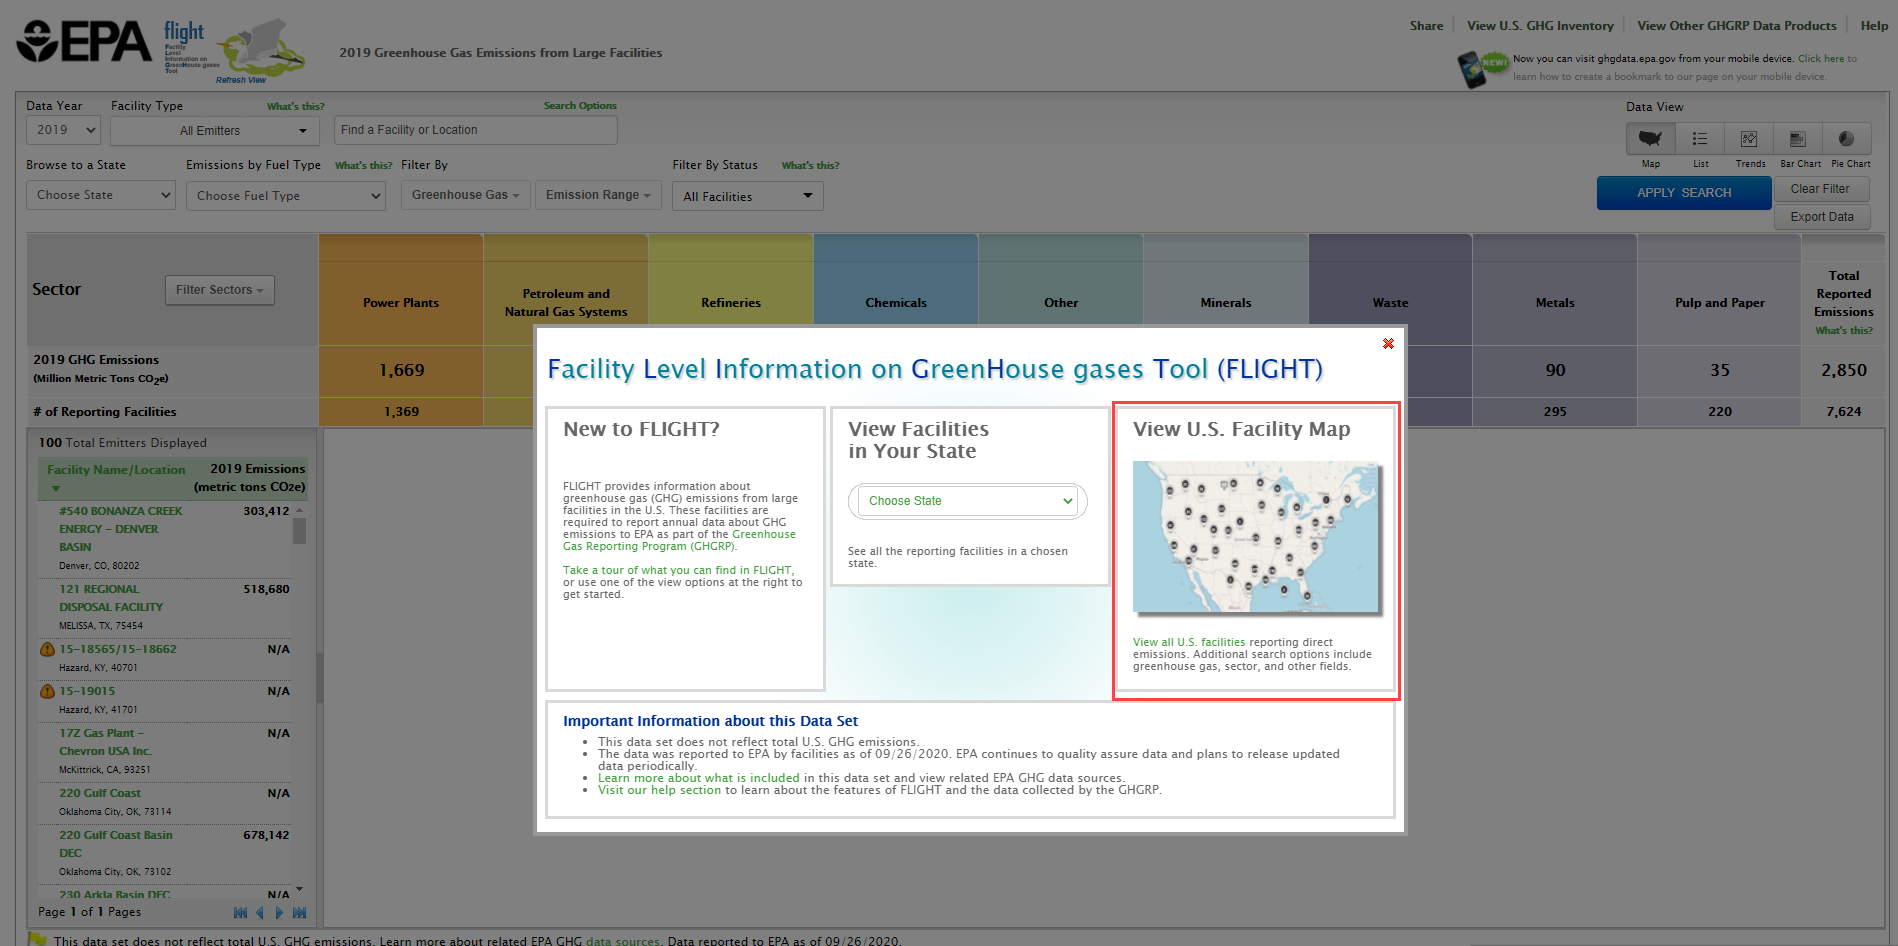
Step 2. Select national search option
Click the box at the left of the popup window to View all U.S. Facility Data.
Click image to expand below
Step 3. Switch from Map View to List view (by facility)
Click the "List" button in the upper right hand corner.
Click image to expand below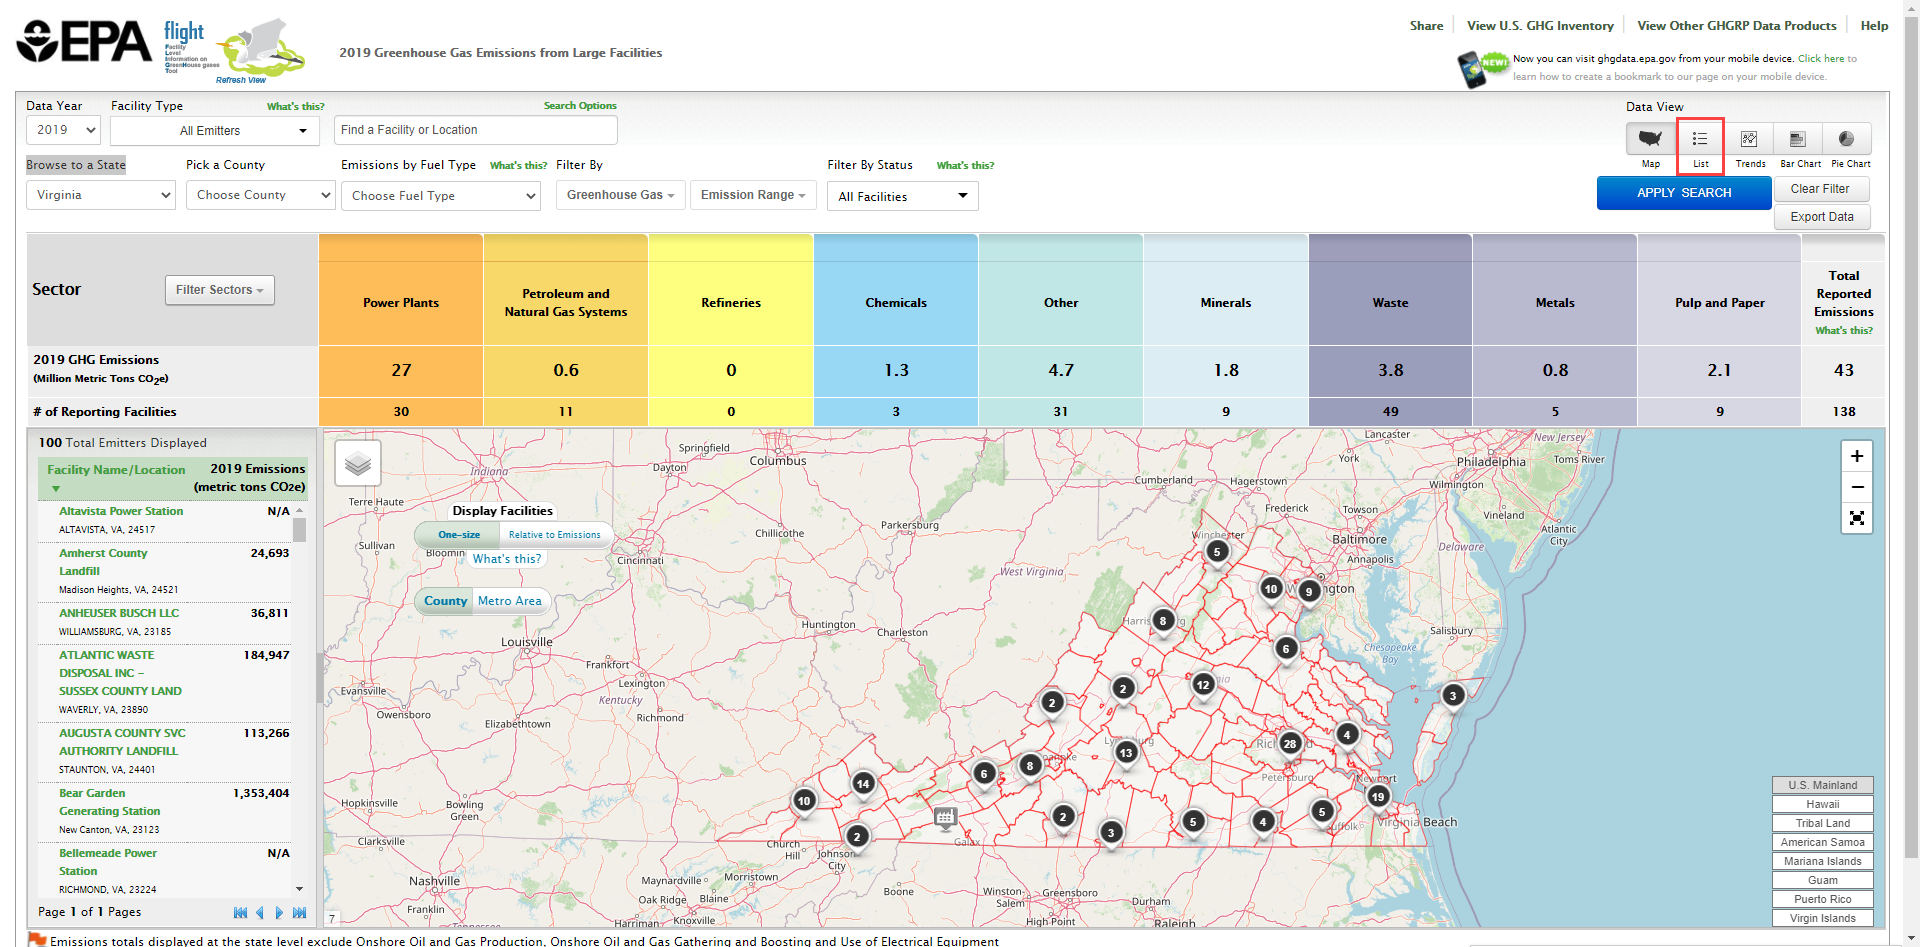

Step 4. Select Changes
Click the Changes icon to display each facility’s reported emissions for 2010, 2011 and the difference between the two years.
Click image to expand below

Step 5. Sort the List
Click the Change in Emissions (2010 to 2011) column header once to sort the list from lowest to highest, then click a second time to sort from highest to lowest.
Click image to expand below

Step 6. Identify the Facility of Interest
The facility at the top of list is the one whose emissions increased the most in your search category.
Click image to expand below
