...
Click on the “Line Chart” button to view facility trends in emissions over time by sector.
Click image to expand below Image Removed
 Image Added
Step 4. Select Desired Parameters
...
Click image to expand below Image Removed
 Image Added
Step 5. Download Chart
...
Click image to expand below Image Removed
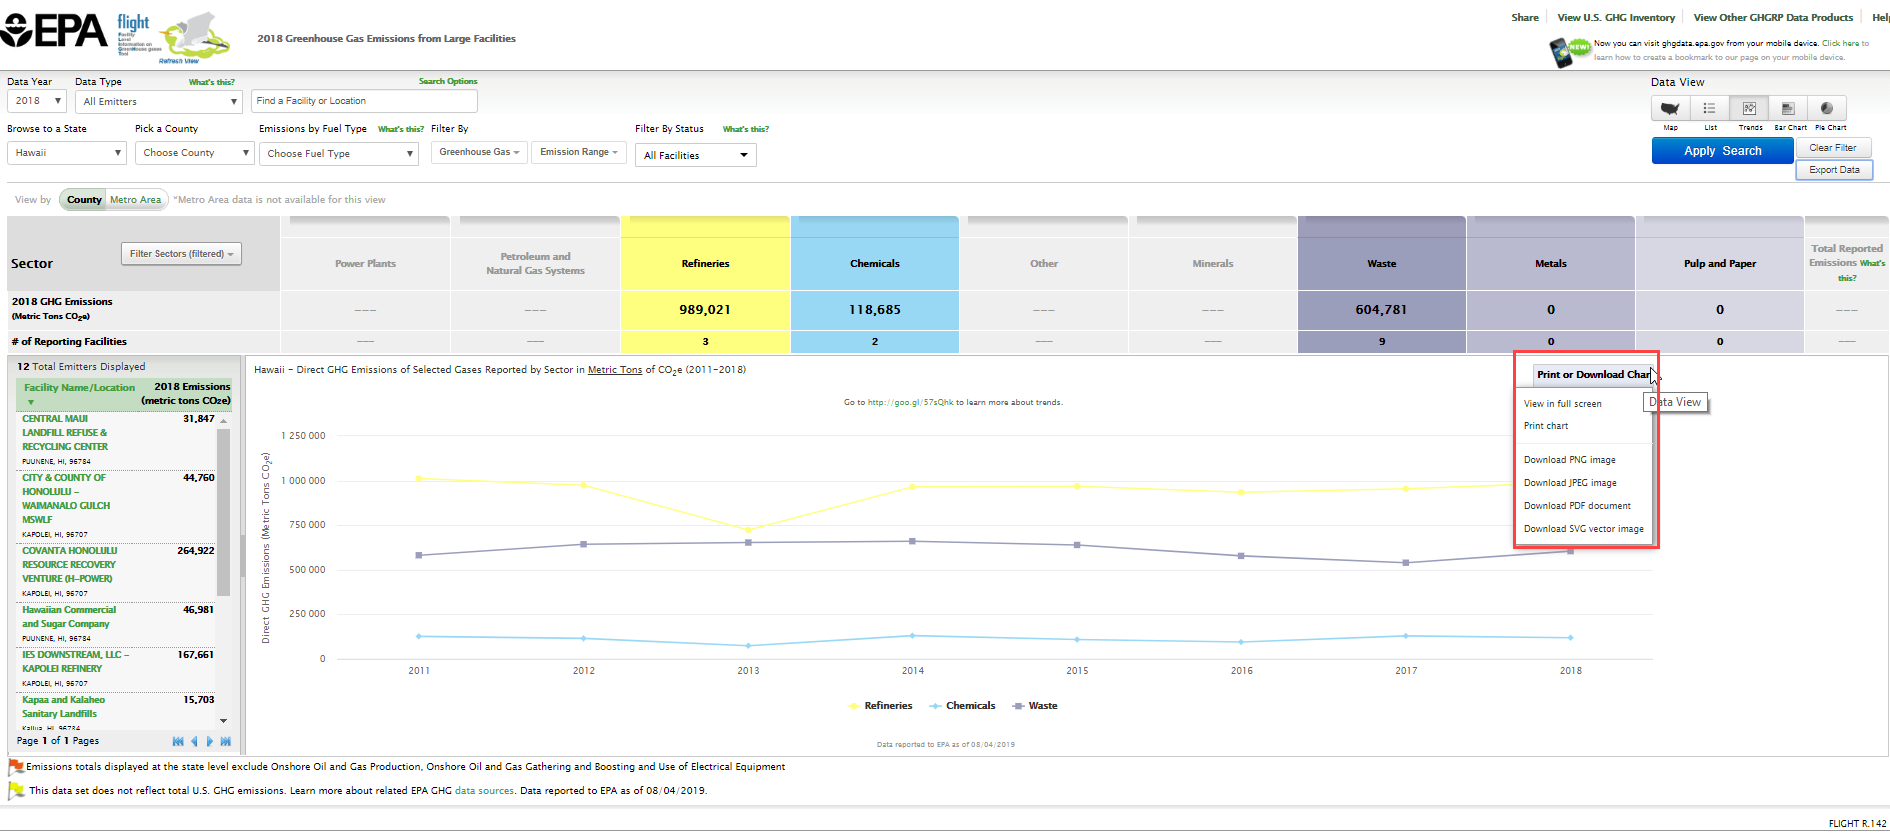 Image Added
 Step 6. Zoom in Lower Portion of the Chart
...
Click image to expand below Image Added
 Image Removed
...
To reset the view, click on the "Reset Zoom" Button
click image to expand below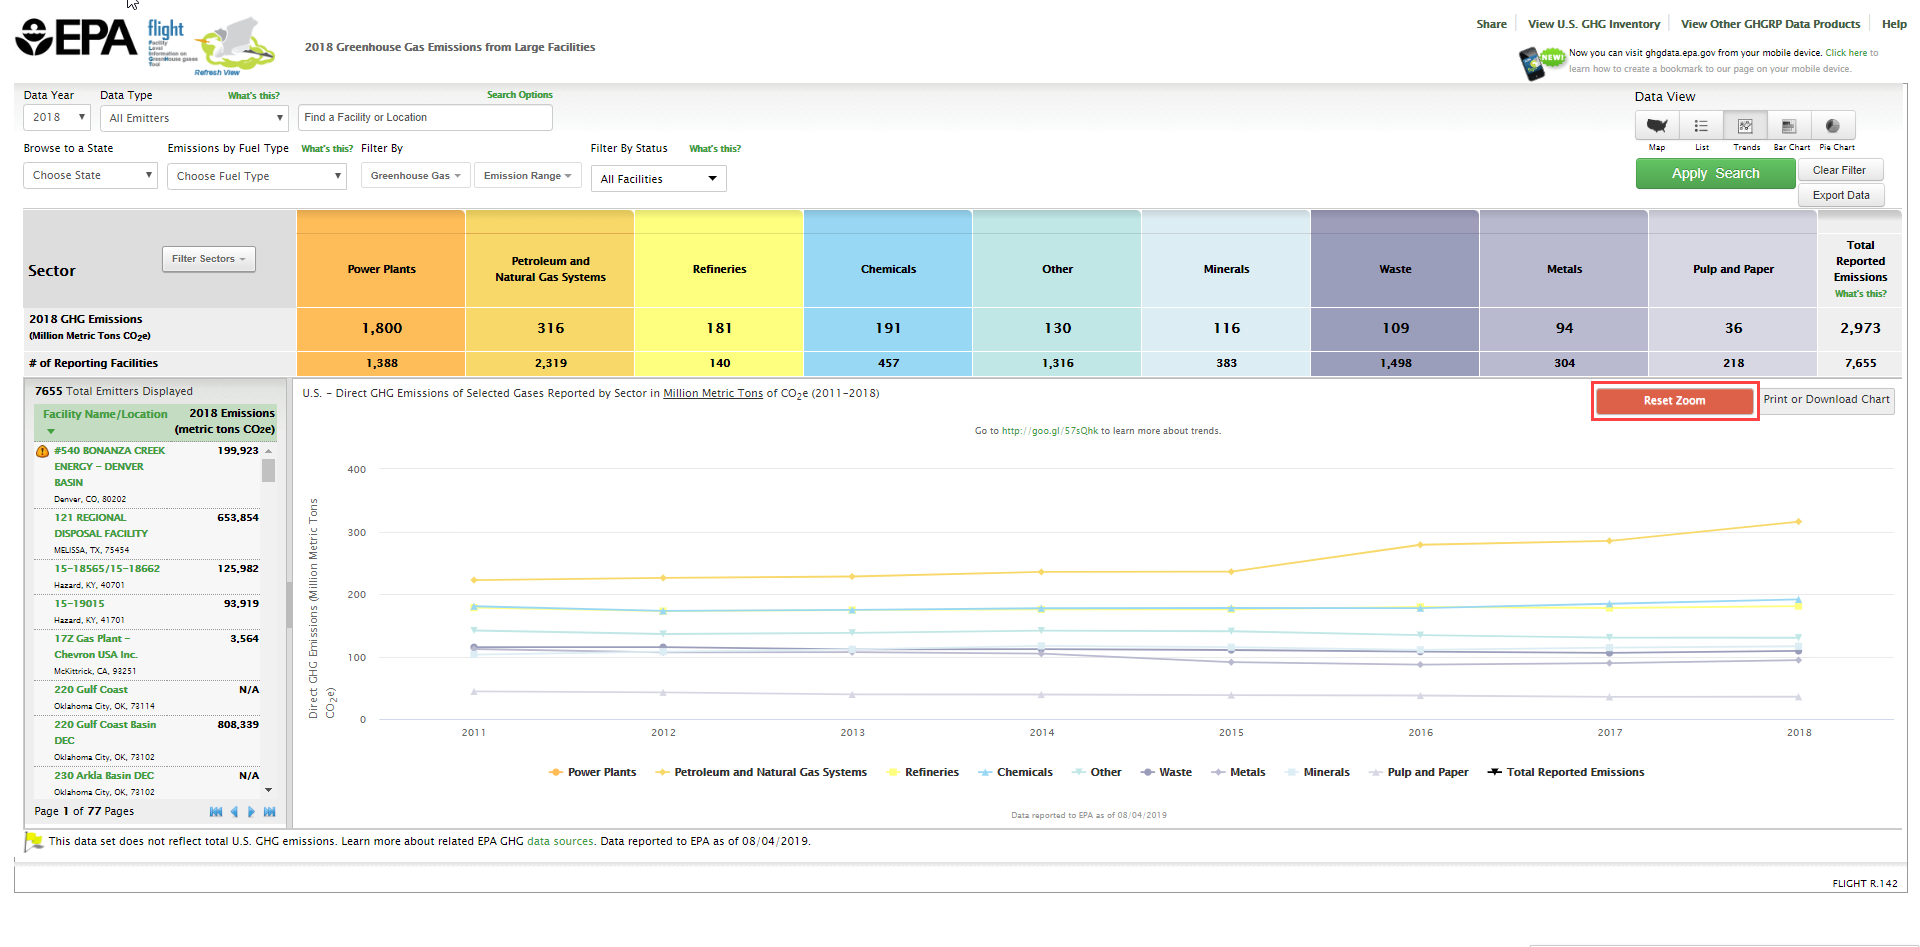 Image Added
Back to Top