This page provides step-by-step instructions for finding information on sector-level emissions trends.
| Excerpt Include |
|---|
| How do I find GHG data from Suppliers, Facilities that Inject C02, or Onshore Oil and Gas Production? |
|---|
| How do I find GHG data from Suppliers, Facilities that Inject C02, or Onshore Oil and Gas Production? |
|---|
| nopanel | true |
|---|
|
Click on the “Line Chart” button to view facility trends in emissions over time by sector.
Click image to expand below
Select the industry types you would like to plot using the dashboard at the bottom of the screen, the geographic region you would like to plot using the state/country drop down menu, and the GHGs you would like to plot using the GHG drop down menu.
Click image to expand below
Once you have selected your parameters, you can also download your view as a PNG, JPEG, PDF, or SVG vector image by selecting the “Print or Download Chart” in the upper right section of the screen.
Click image to expand below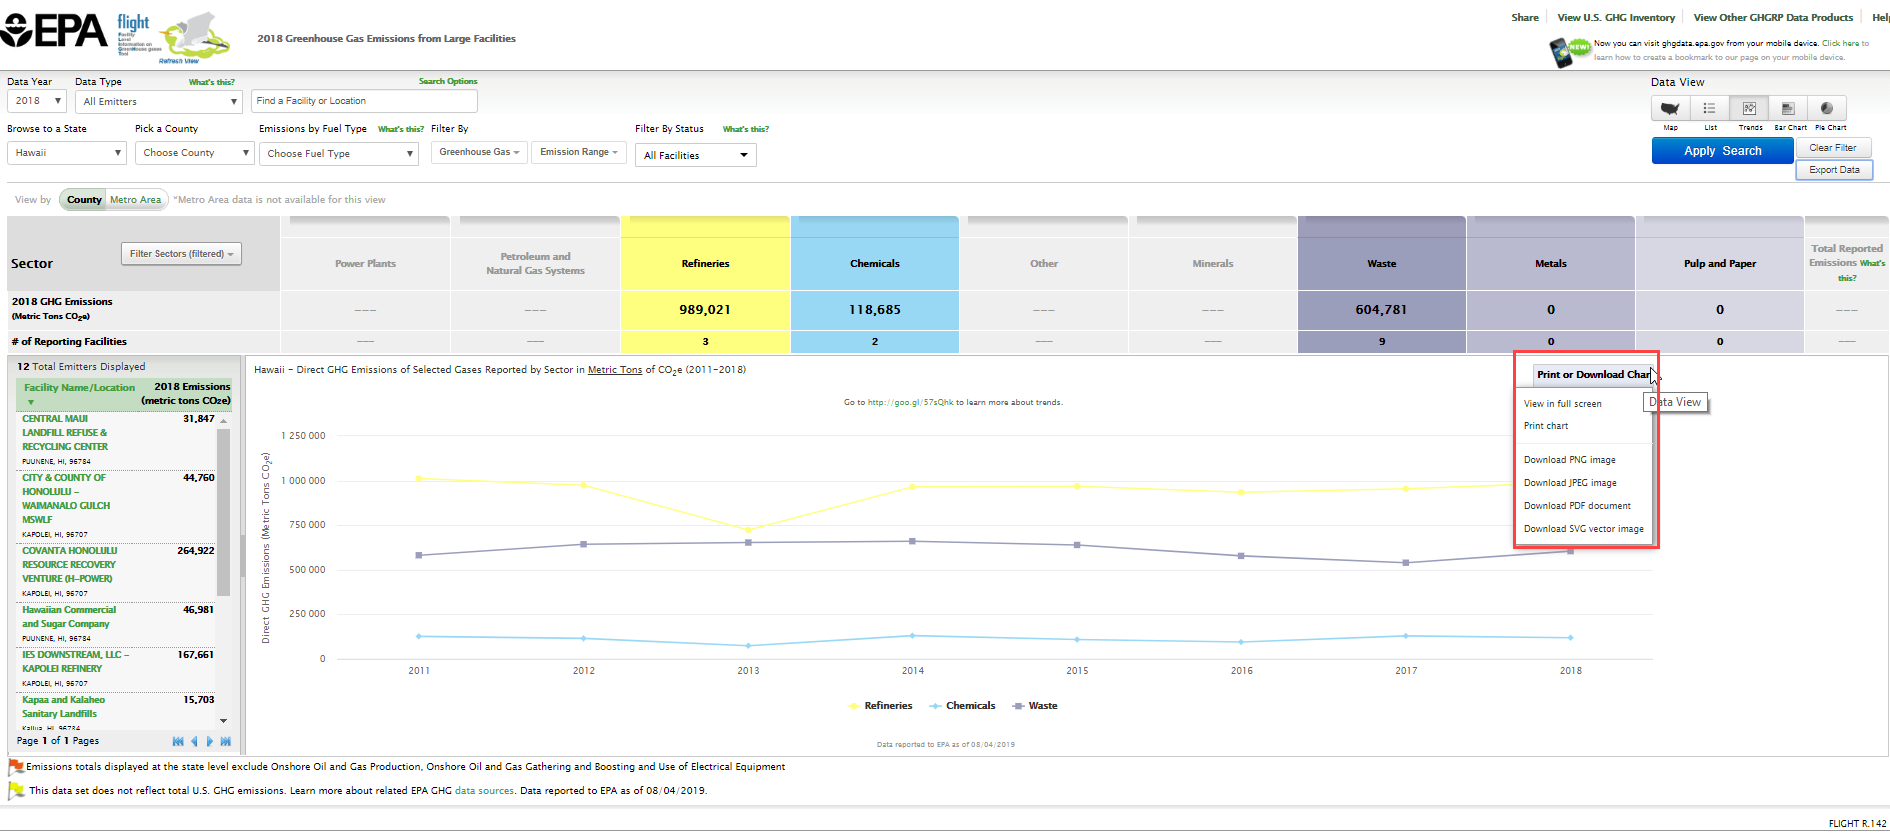
In many cases a number of trend lines may be crowded on the lower portions of the chart. To get a magnified view of these trend lines, Click "Focus on Bottom Sectors".
Click image to expand below
To reset the view, click on the "Reset Zoom" Button
click image to expand below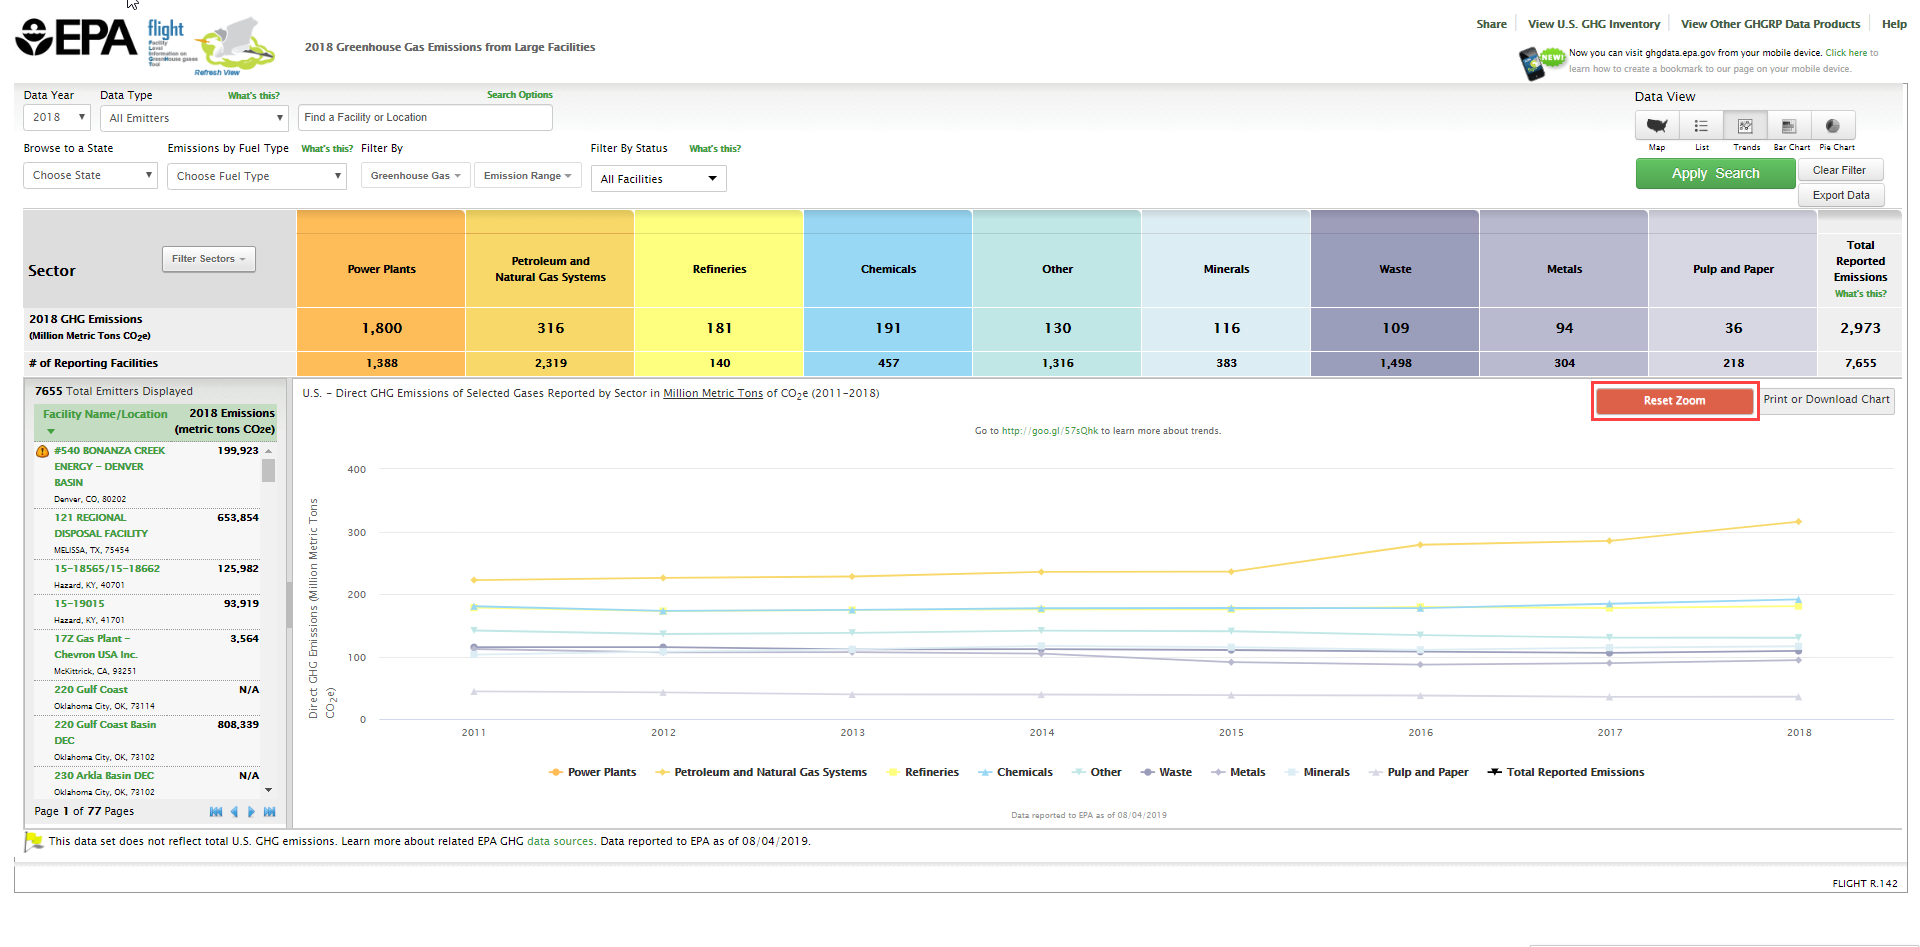
Back to Top