This page provides step-by-step instructions for comparing GHG emissions from different industrial sectors and also describes how to drill down into the data to compare subsectors within an industry.
| Excerpt Include |
|---|
| How do I find GHG data from Suppliers, Facilities that Inject C02, or Onshore Oil and Gas Production? |
|---|
| How do I find GHG data from Suppliers, Facilities that Inject C02, or Onshore Oil and Gas Production? |
|---|
| nopanel | true |
|---|
|
...
Click image to expand below Image Removed
 Image Added
This button will display a breakdown of each sector by GHG emission, as a percent of total emissions. Users can hover over each section for more information, and click each slice of the pie for more detailed information.
Click image to expand below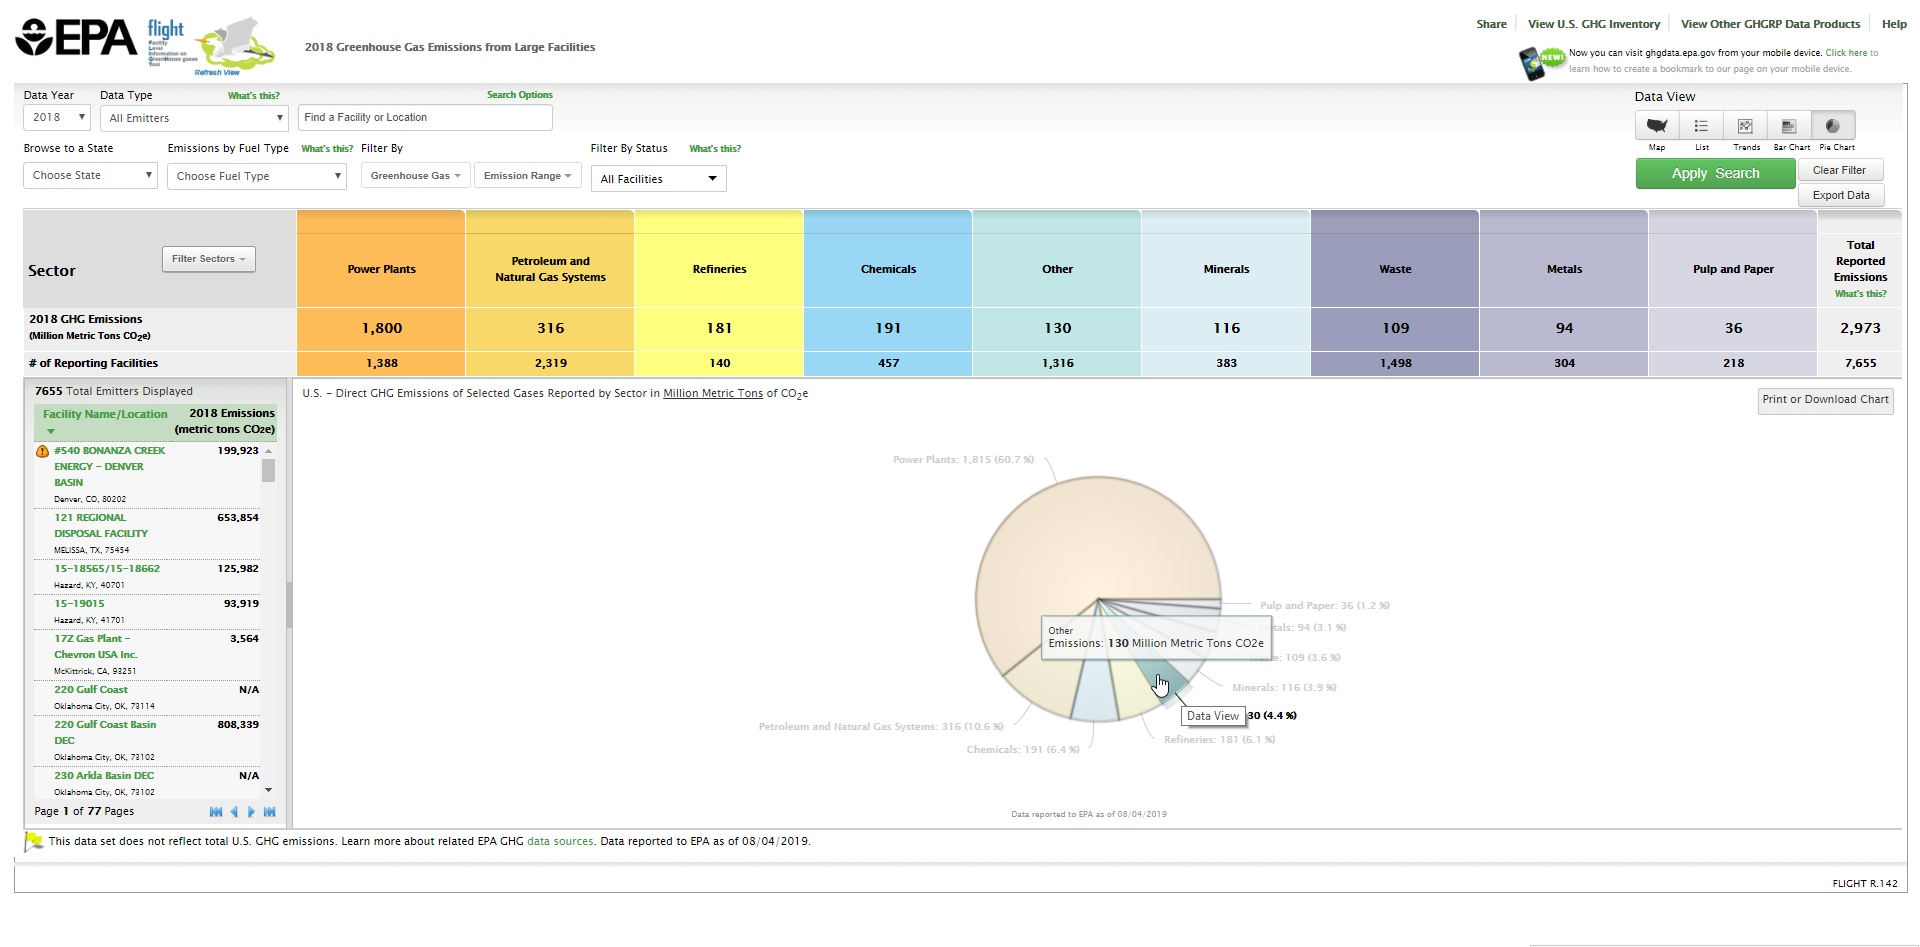 Image Added
Step 4. Compare subsectors within an industry in a pie chart
Click on a sector pie slice to drill down and compare the underlying subsectors within that sector.
Click image to expand below  Image Removed
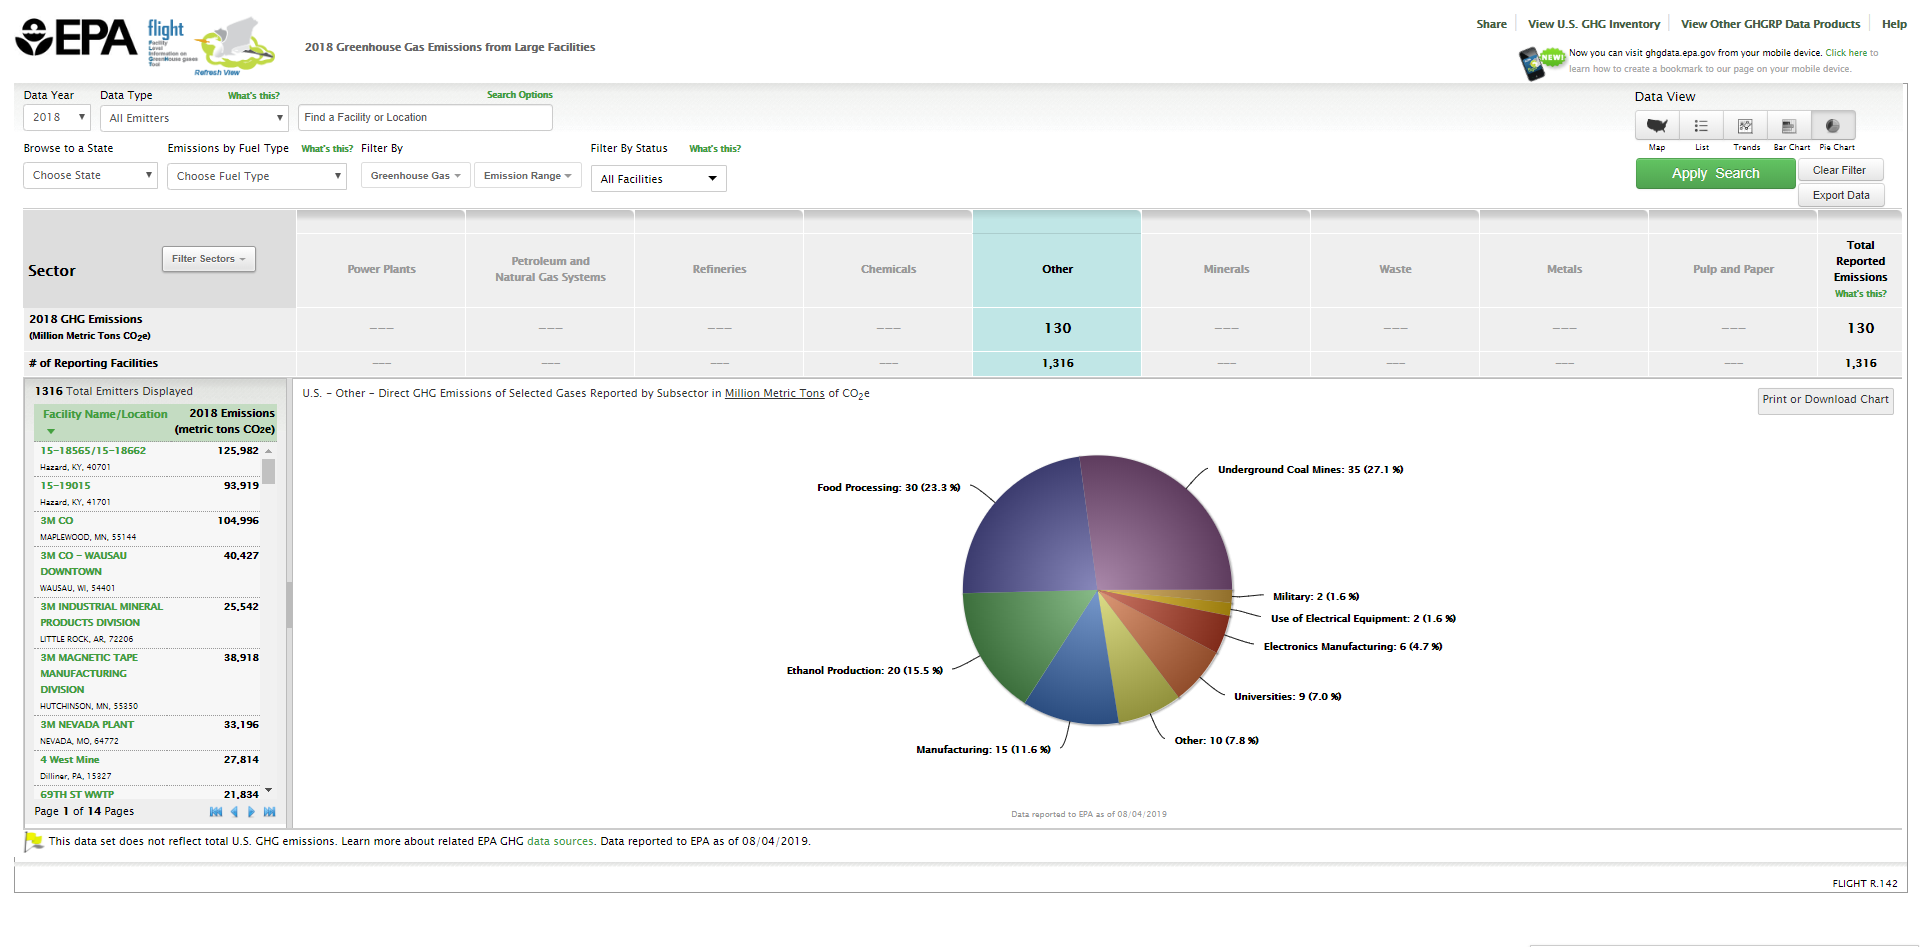 Image Added
Step 5. Compare facilities within a subsector in a pie chart
...
Click image to expand below  Image Removed
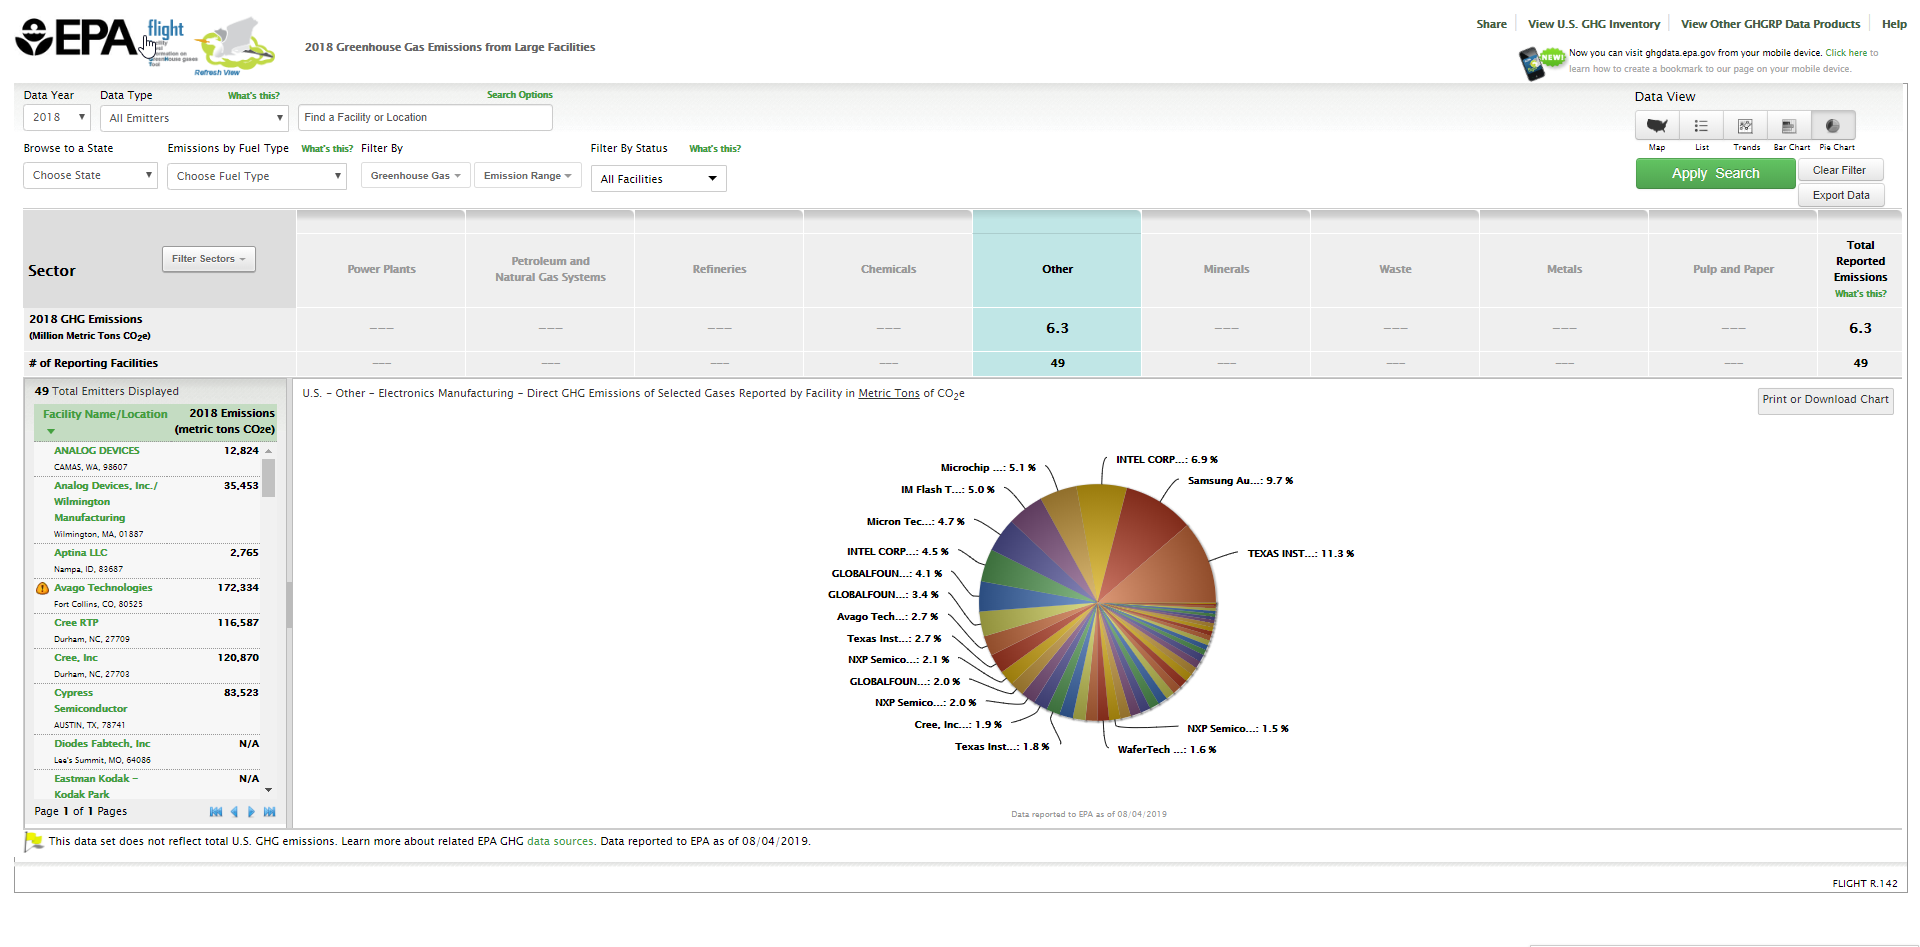 Image Added
Step 6. View details for a facility
...
Click image to expand below  Image Removed
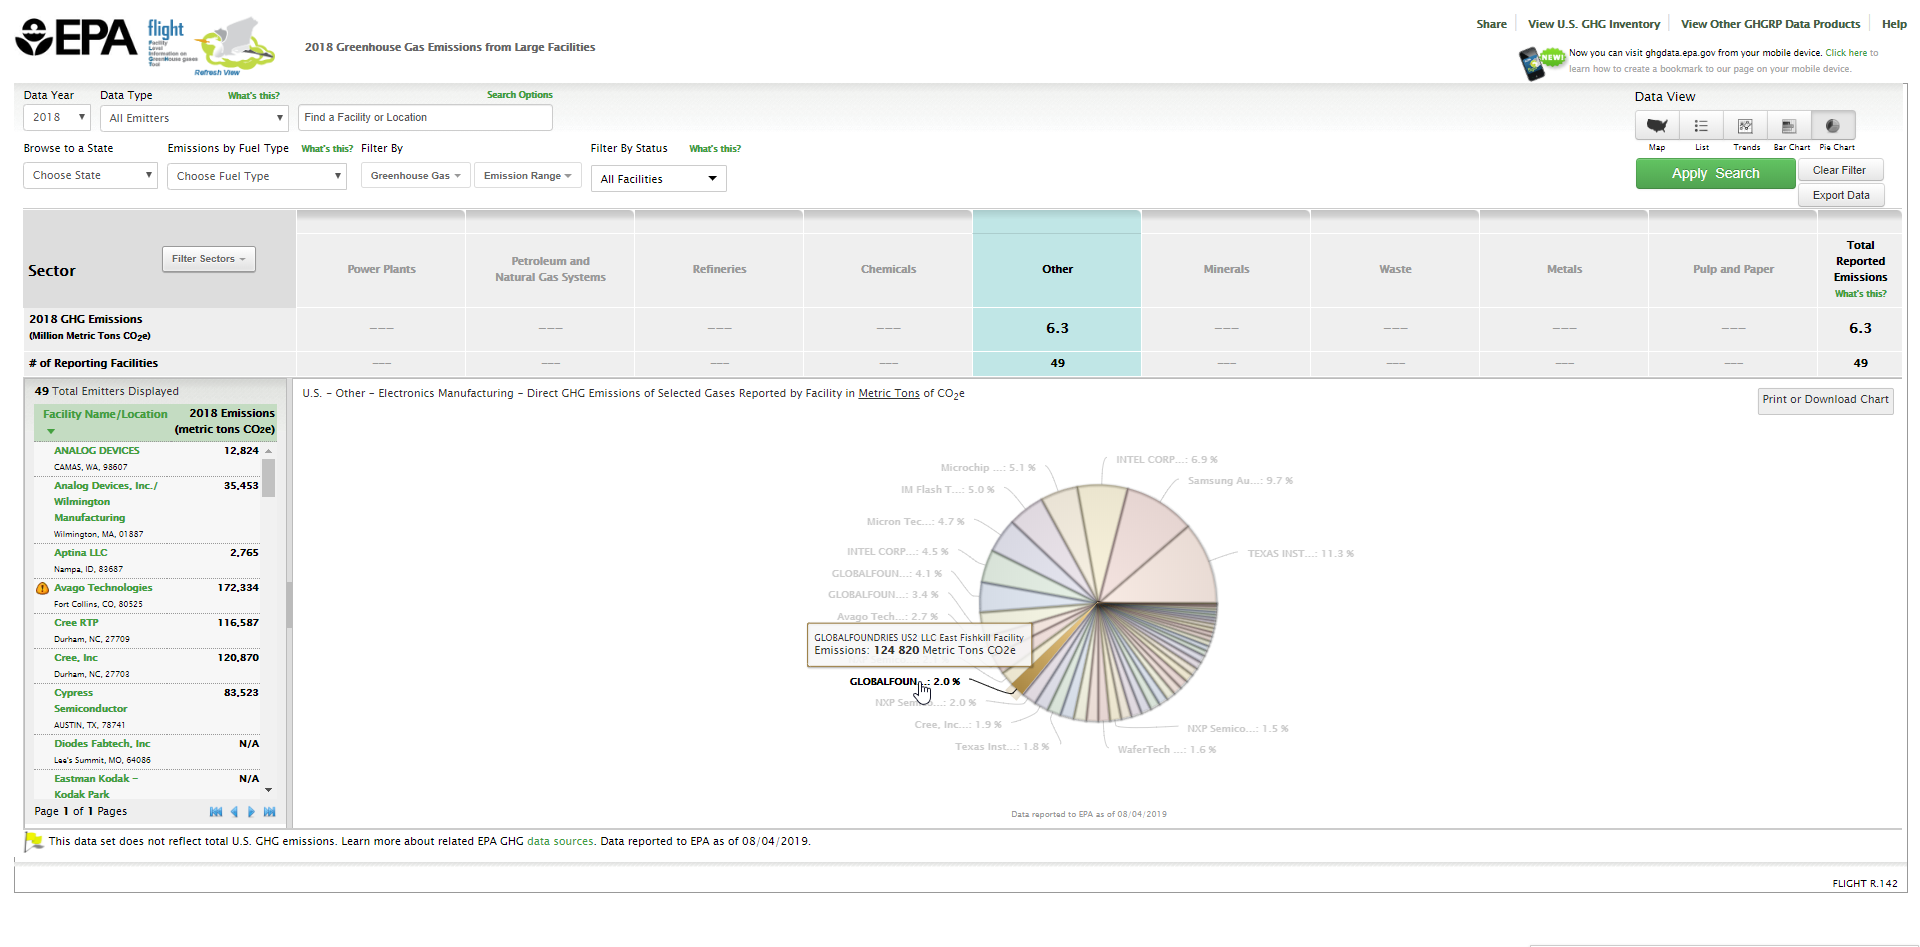 Image Added
The facility details provided include the facility name, location, FRS ID, NAICS code, total emissions, emissions by gas, emissions by source/process, emissions by year (trend graph), and additional information reported by the facility.
Click image to expand below  Image Removed
 Image Added
#Back to Top