...
Click image to expand below 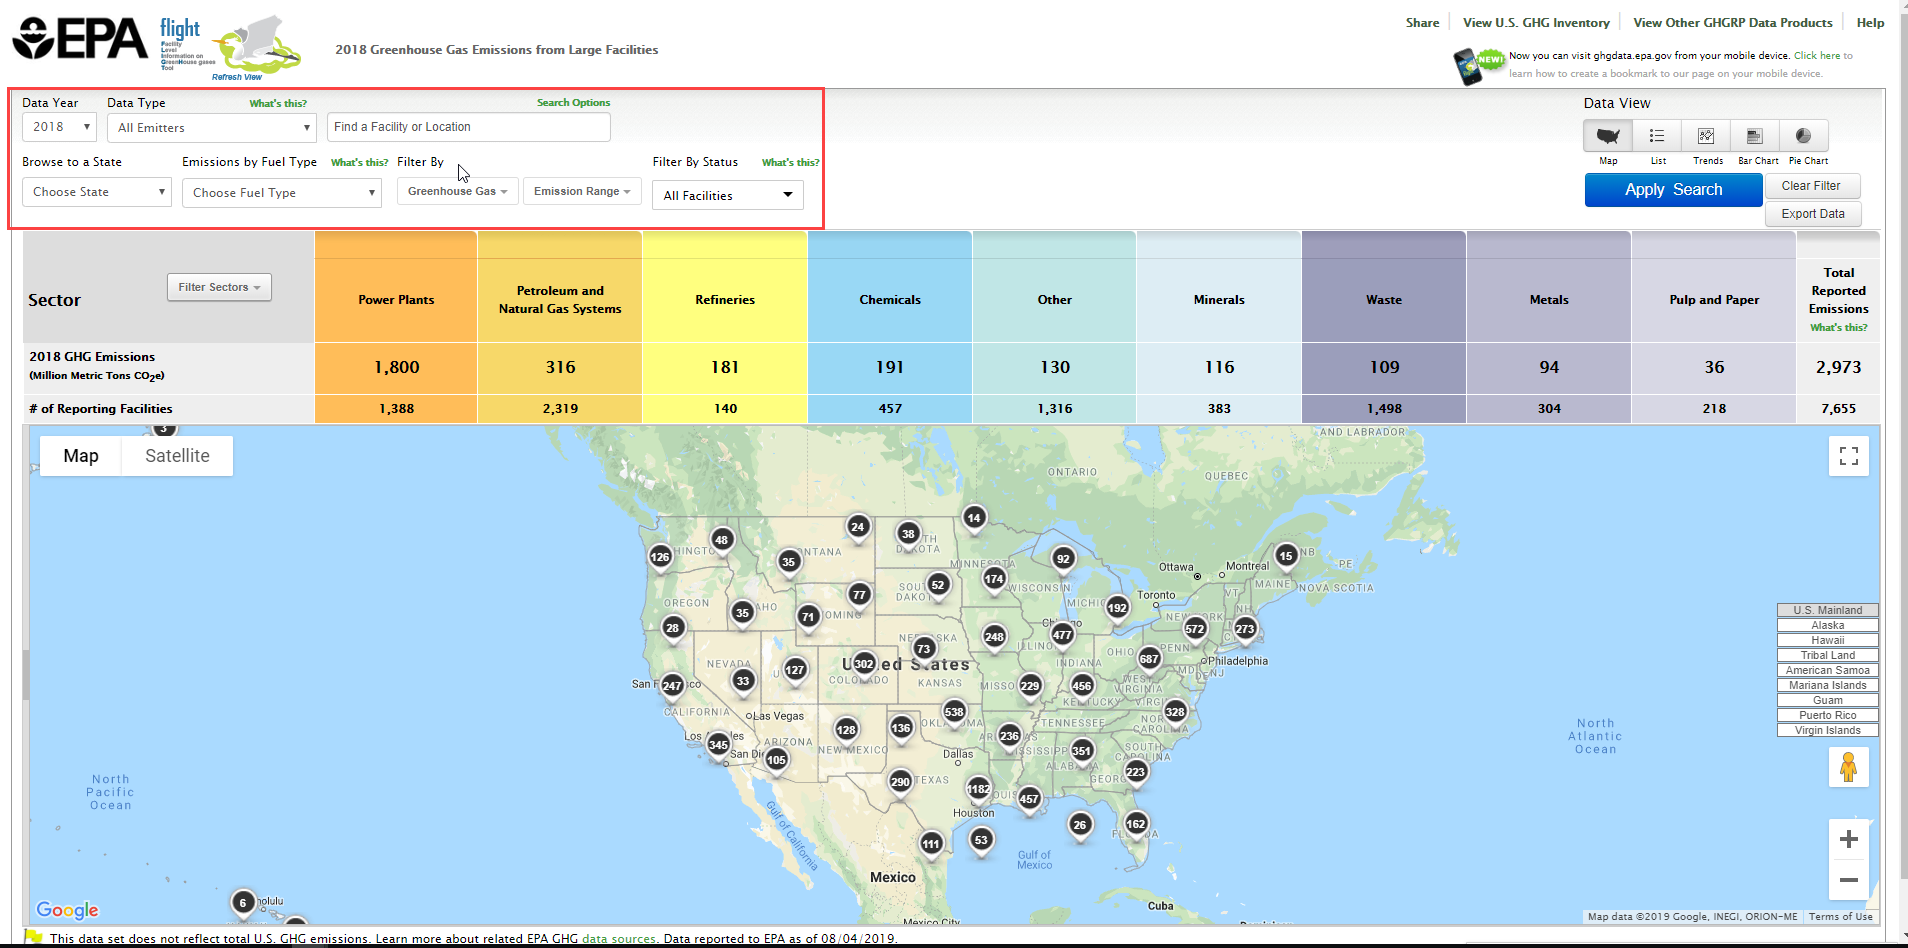 Image Removed
 Image Added
Click the "GREENHOUSE GAS" drop-down bar, and use the checkboxes to filter by GHG type (all GHG types are initially selected by default). Once you have made your selections, click "APPLY" to apply the filter to the map and data. You may minimize the "GREENHOUSE GAS" drop-down bar by clicking it again, or you may get rid of it by clicking the "x" in the top right corner of it.
Click image to expand below 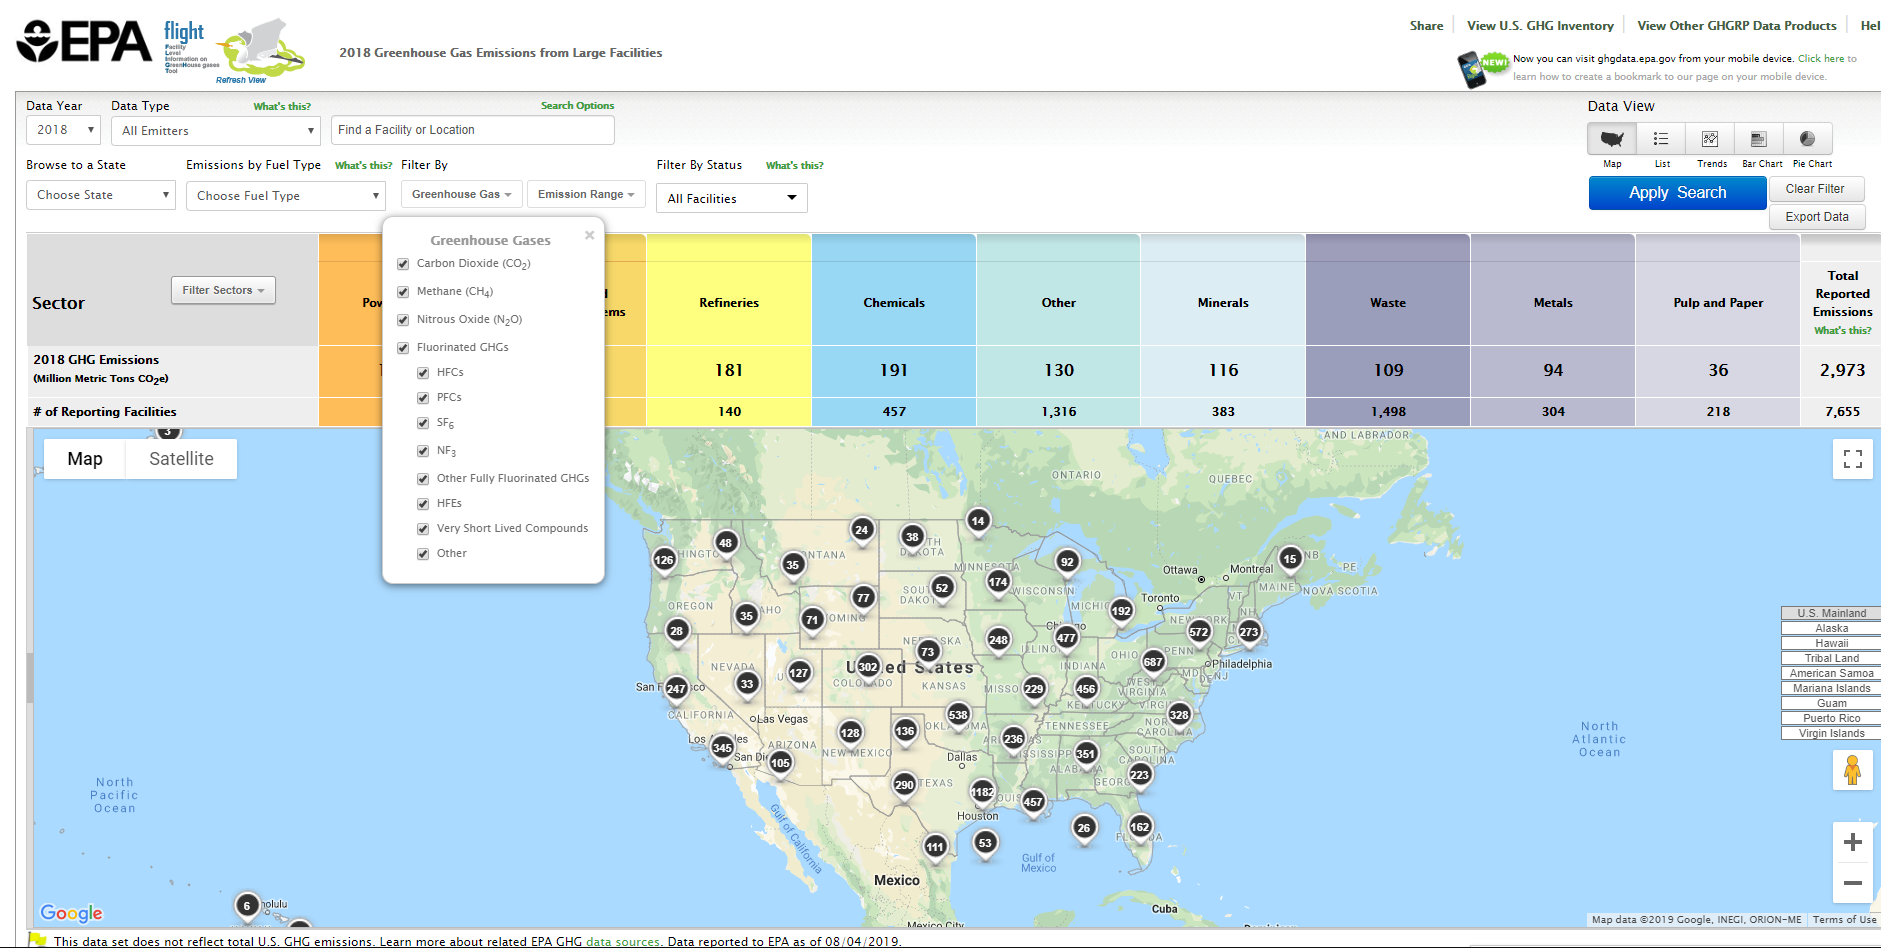 Image Removed
 Image Added
Click the "EMISSIONS RANGE" drop-down, and drag the sliders to set a minimum and/or maximum value for annual facility emissions. Alternatively, you may type minimum and maximum values manually in the provided text boxes. Once you have set your minimum and maximum values, click "APPLY" to apply the filter to the map and data. You may minimize the "EMISSIONS RANGE" drop-down bar by clicking it again, or you may get rid of it by clicking the "x" in the top right corner of it.
Click image to expand below 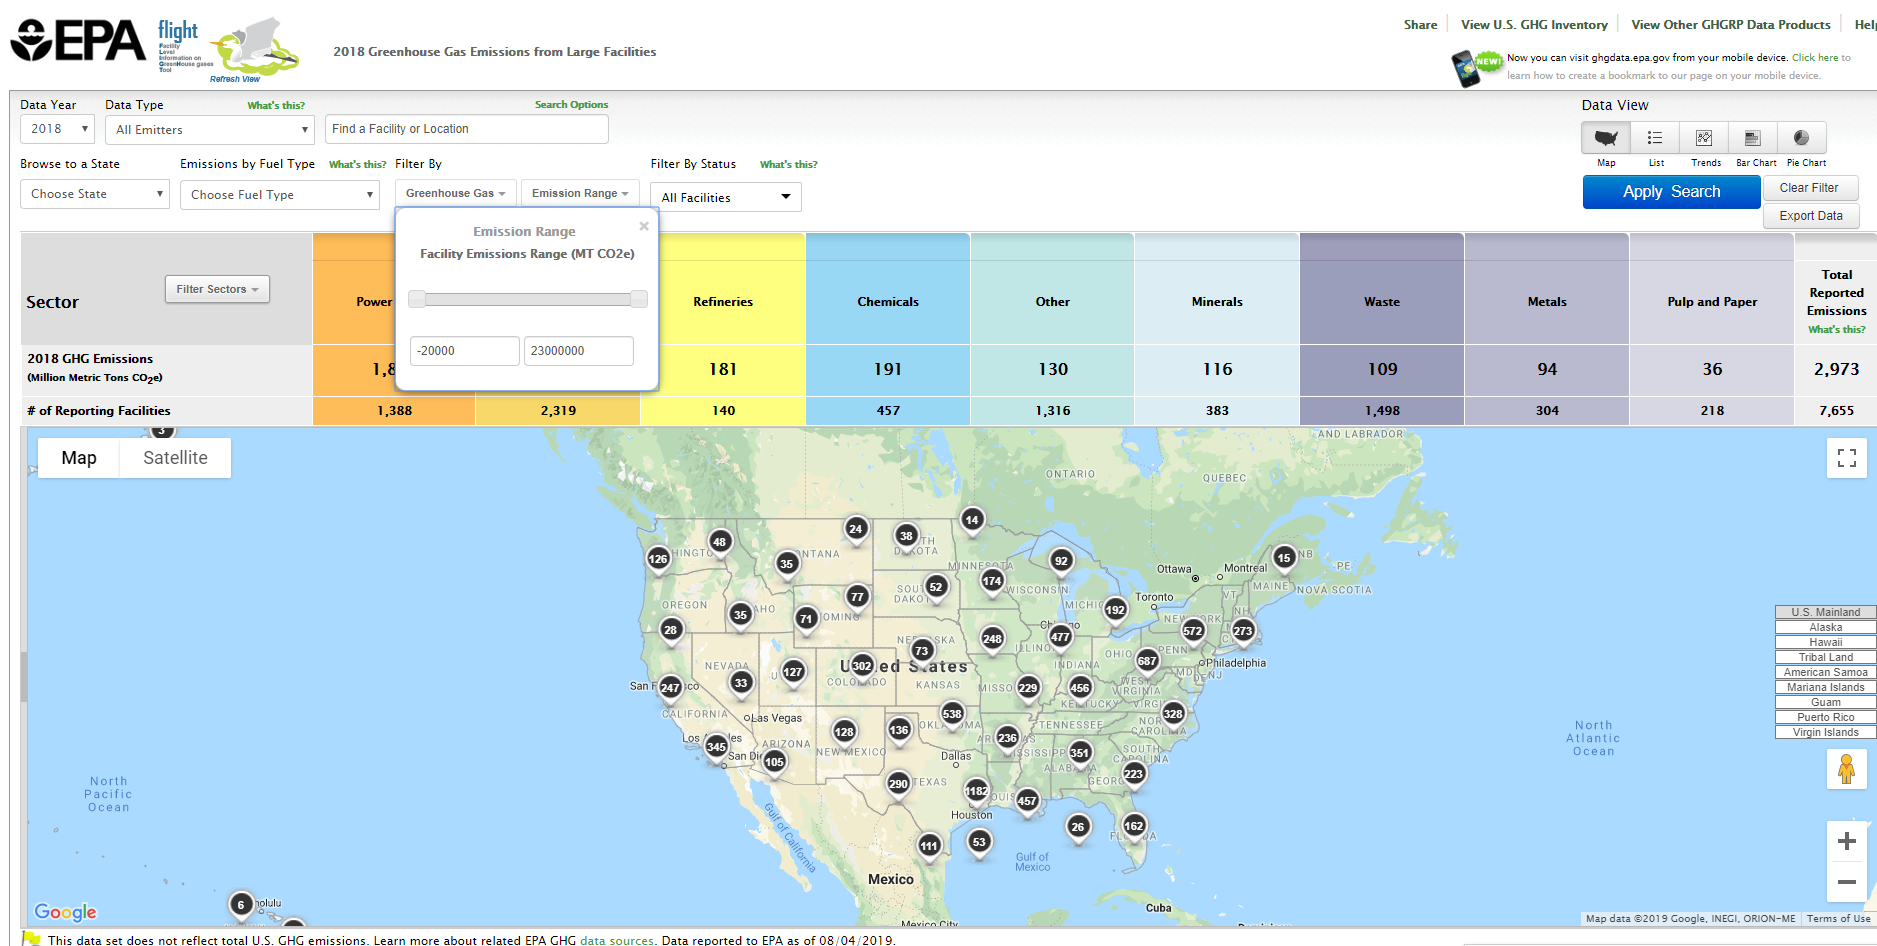 Image Removed
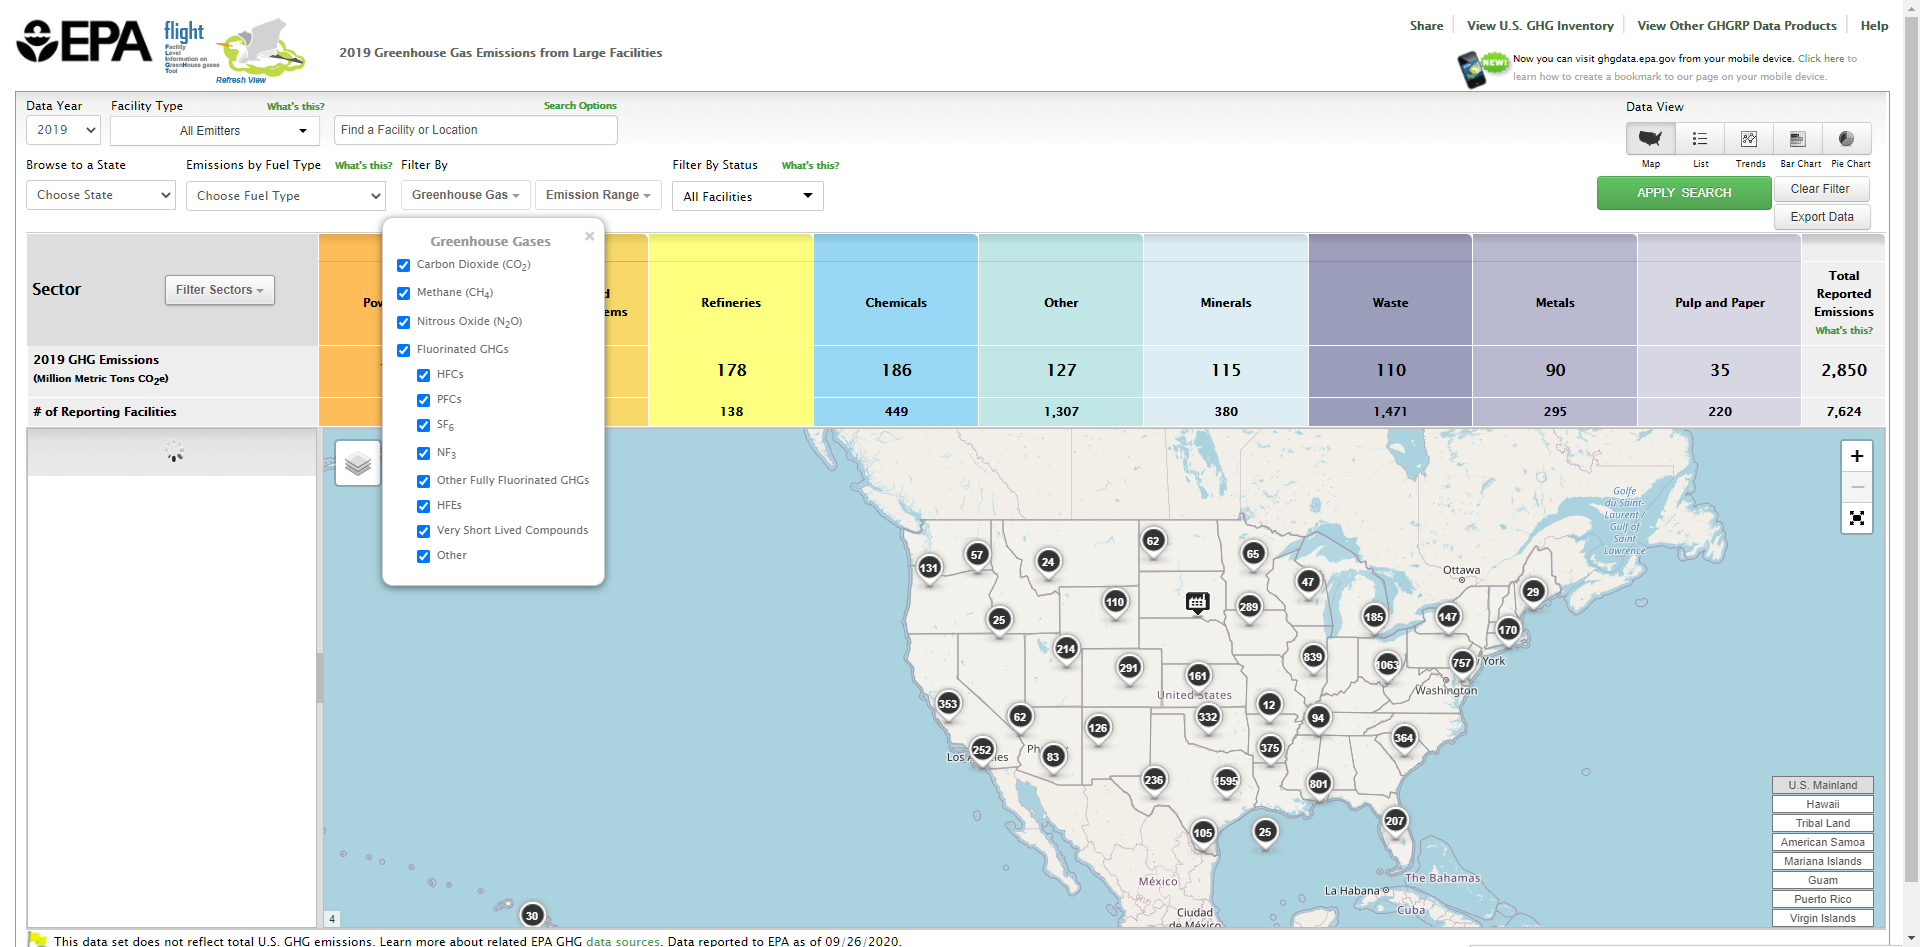 Image Added
List of Emitters
...
Click image to expand below 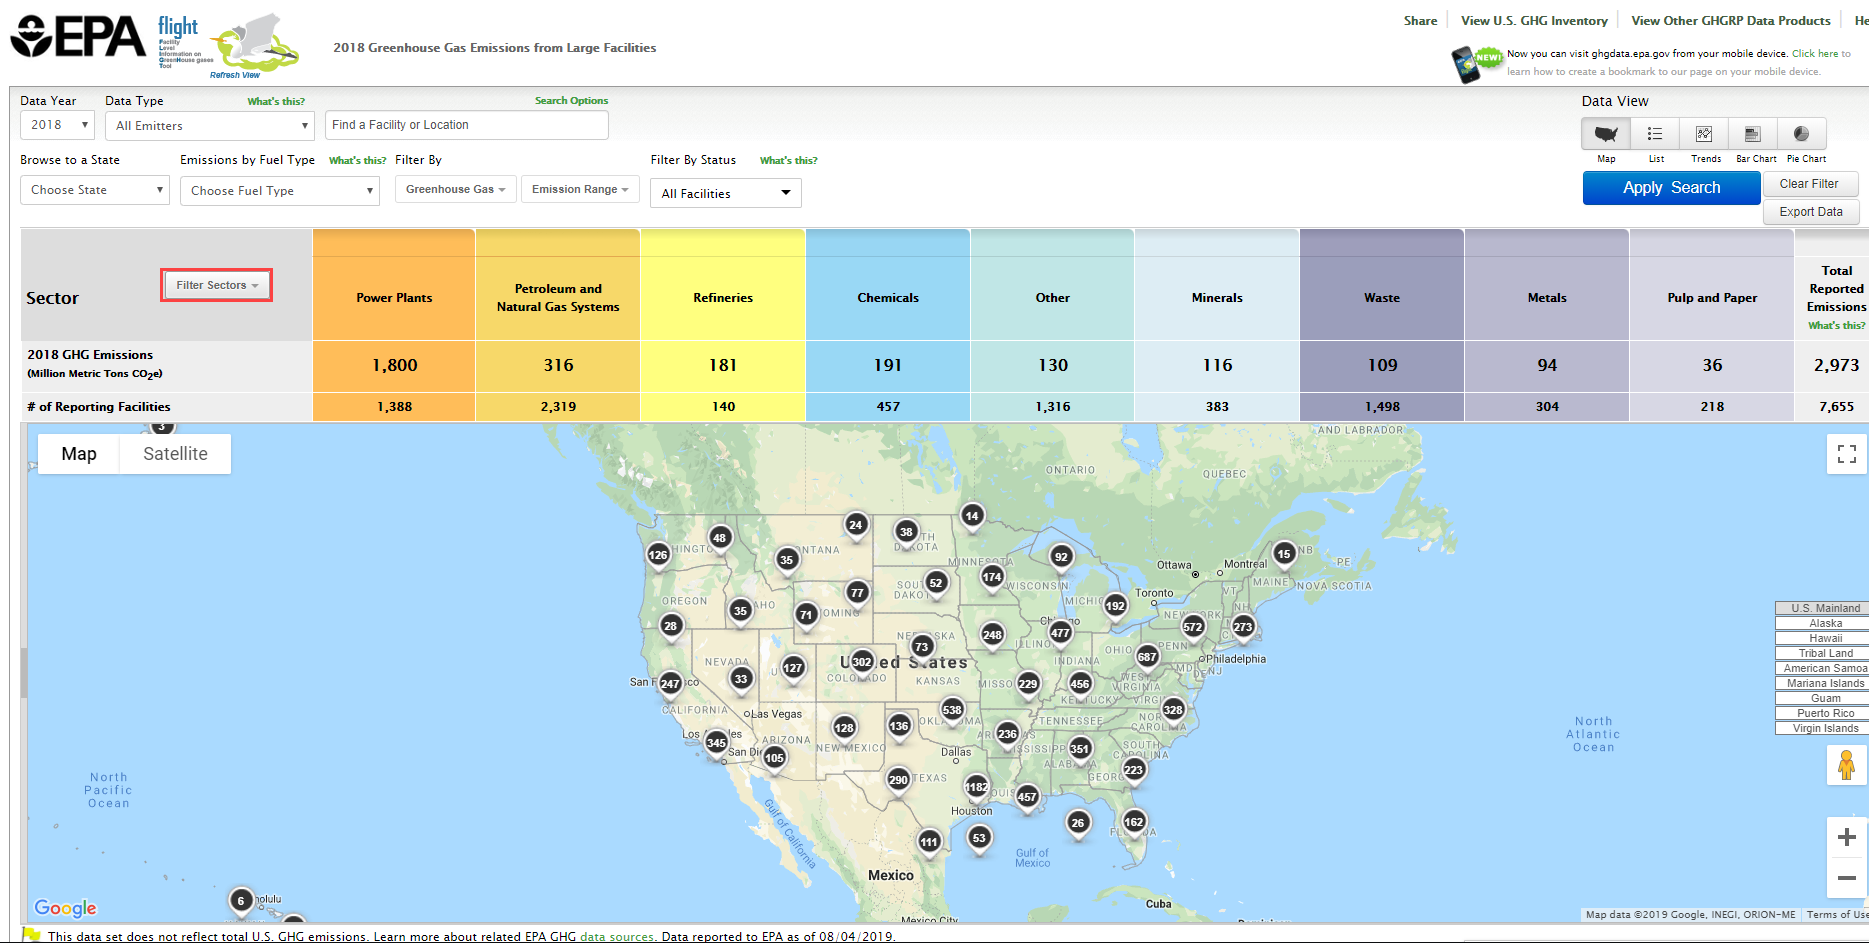 Image Removed
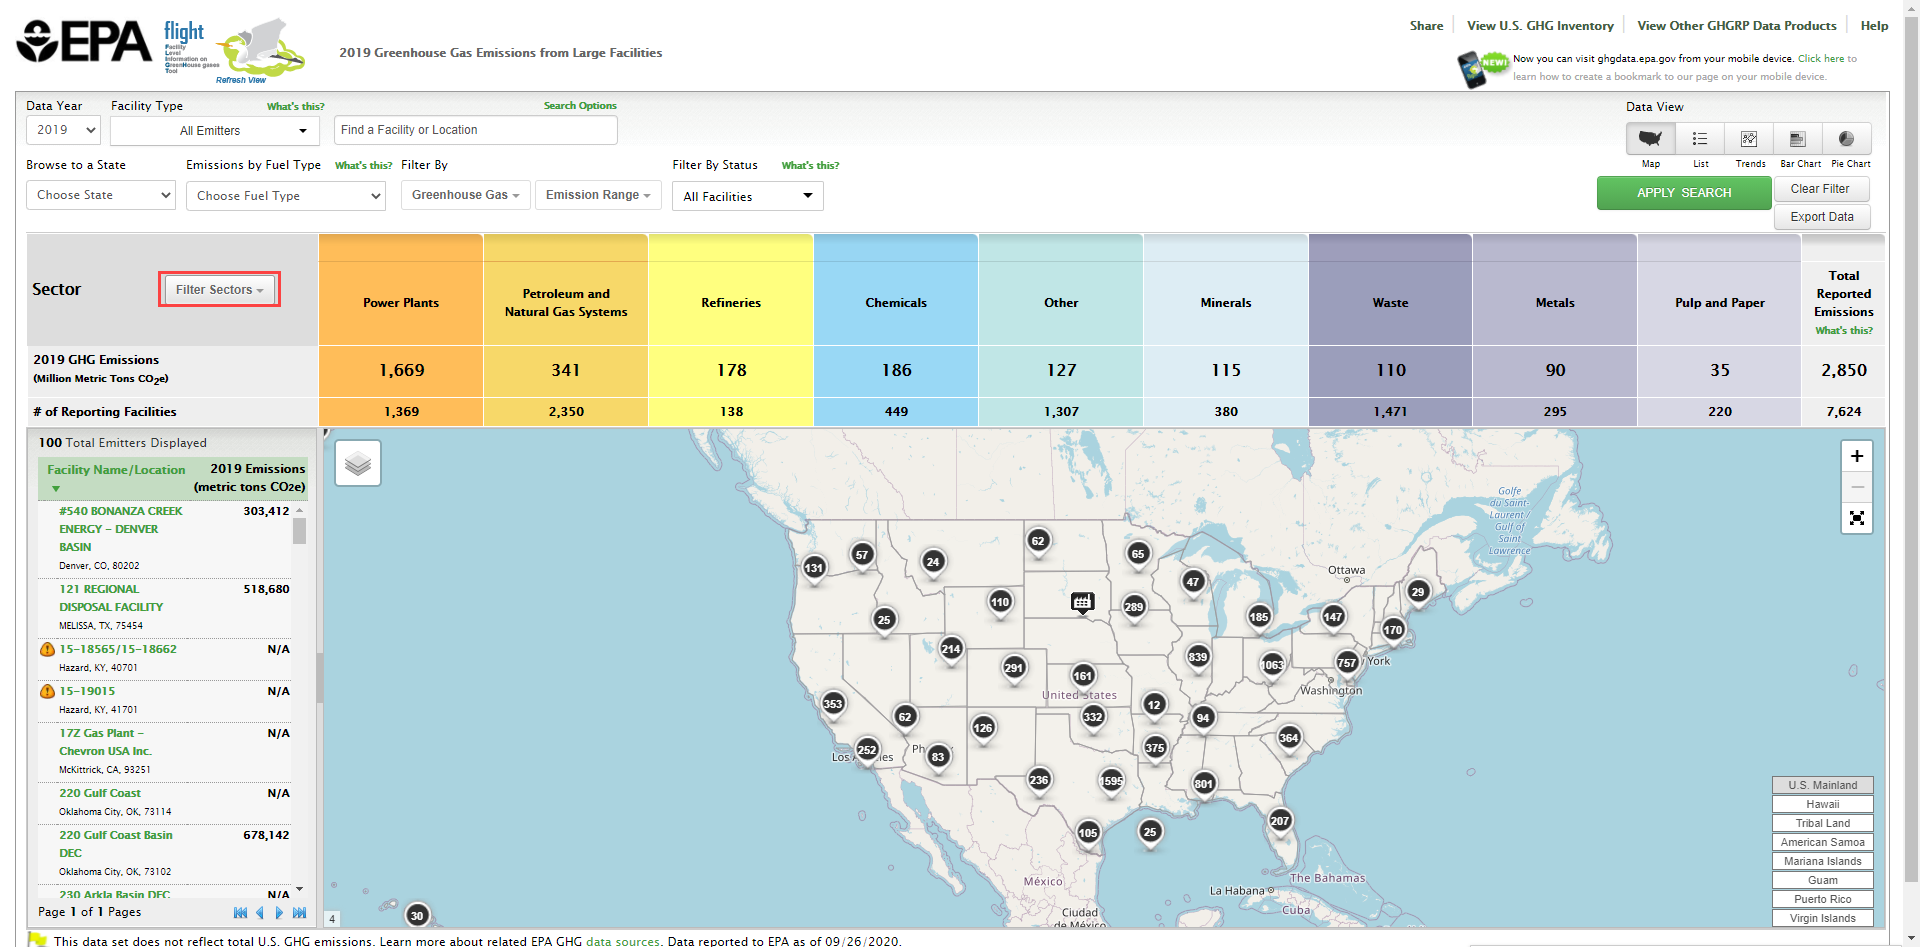 Image Added
Note: users may select several check boxes at one time, across several different sectors.
click this image to expand below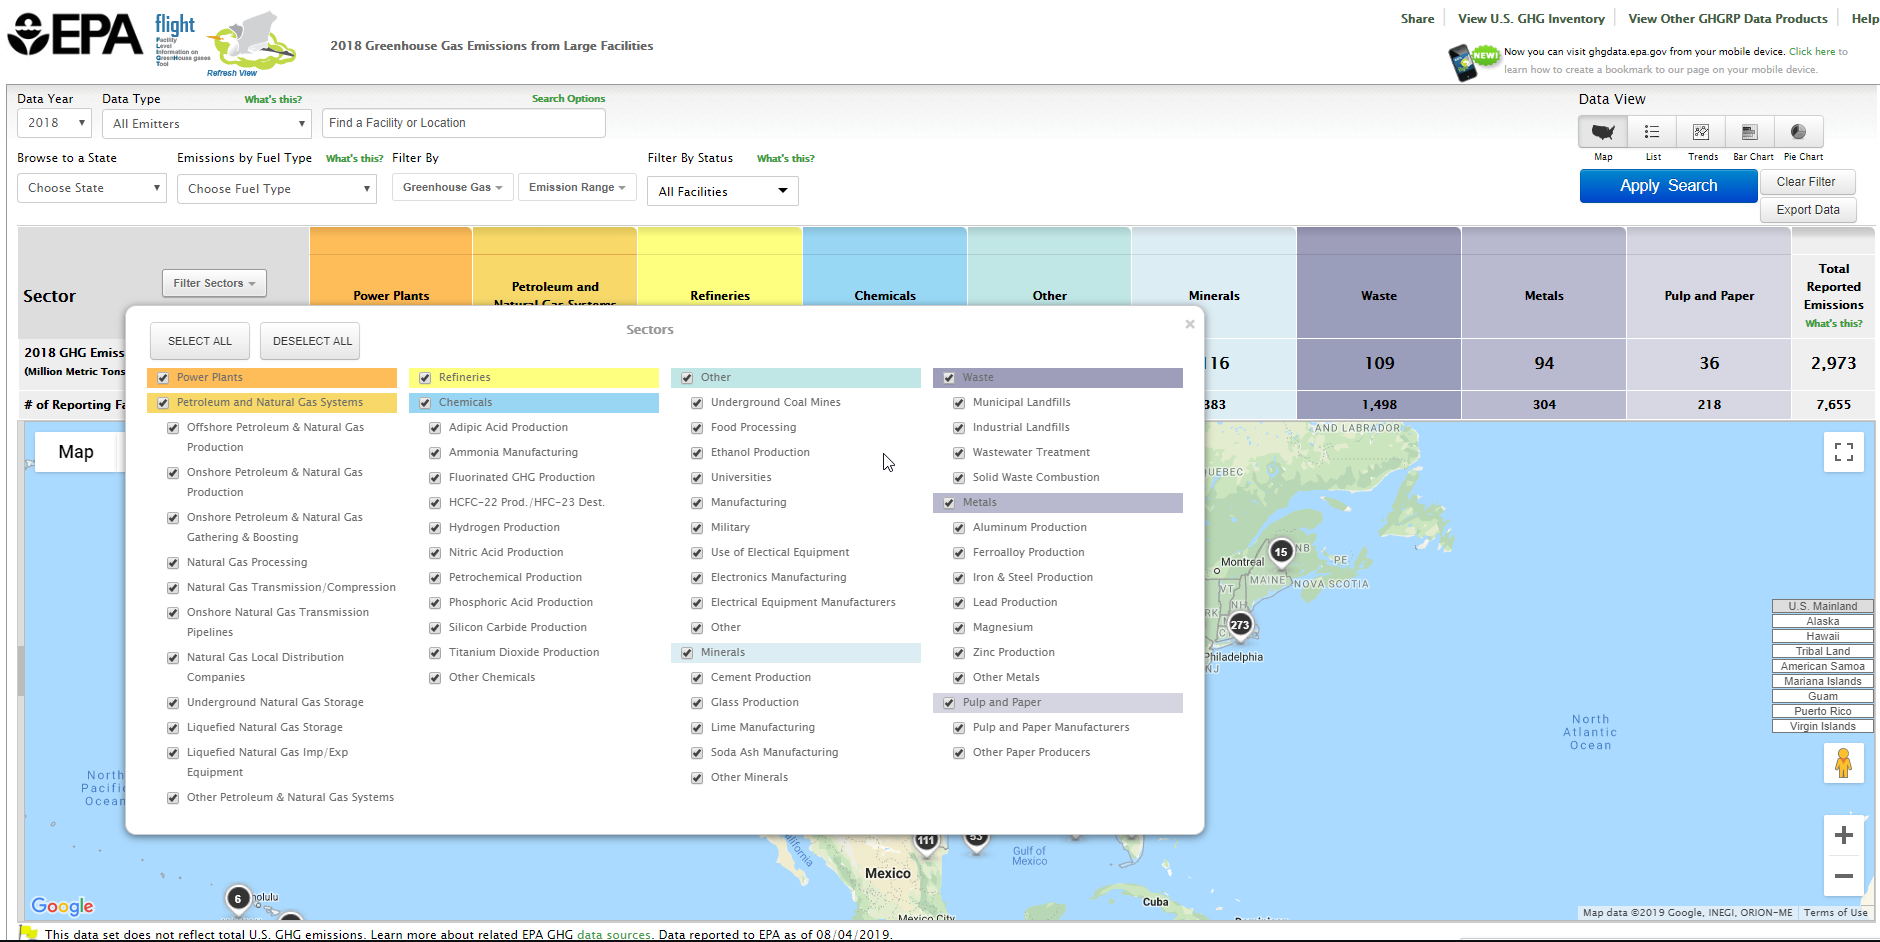 Image Removed
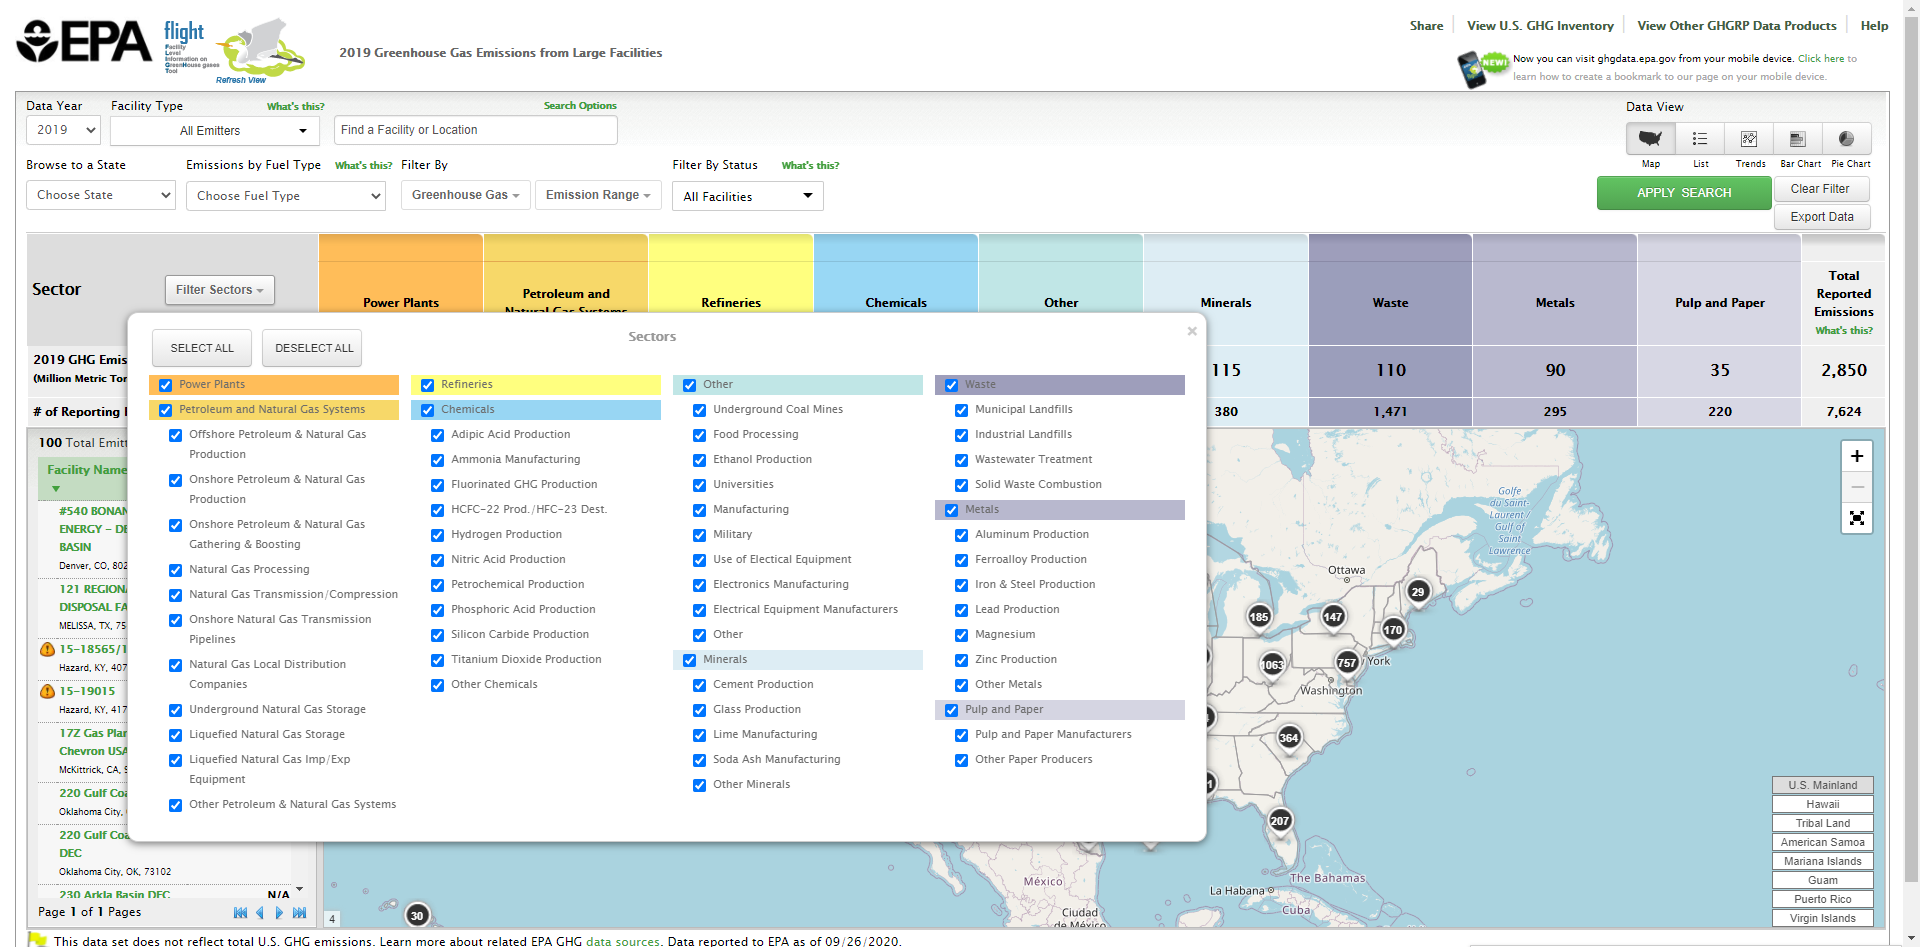 Image Added
Visualizations
...
Click image to expand below 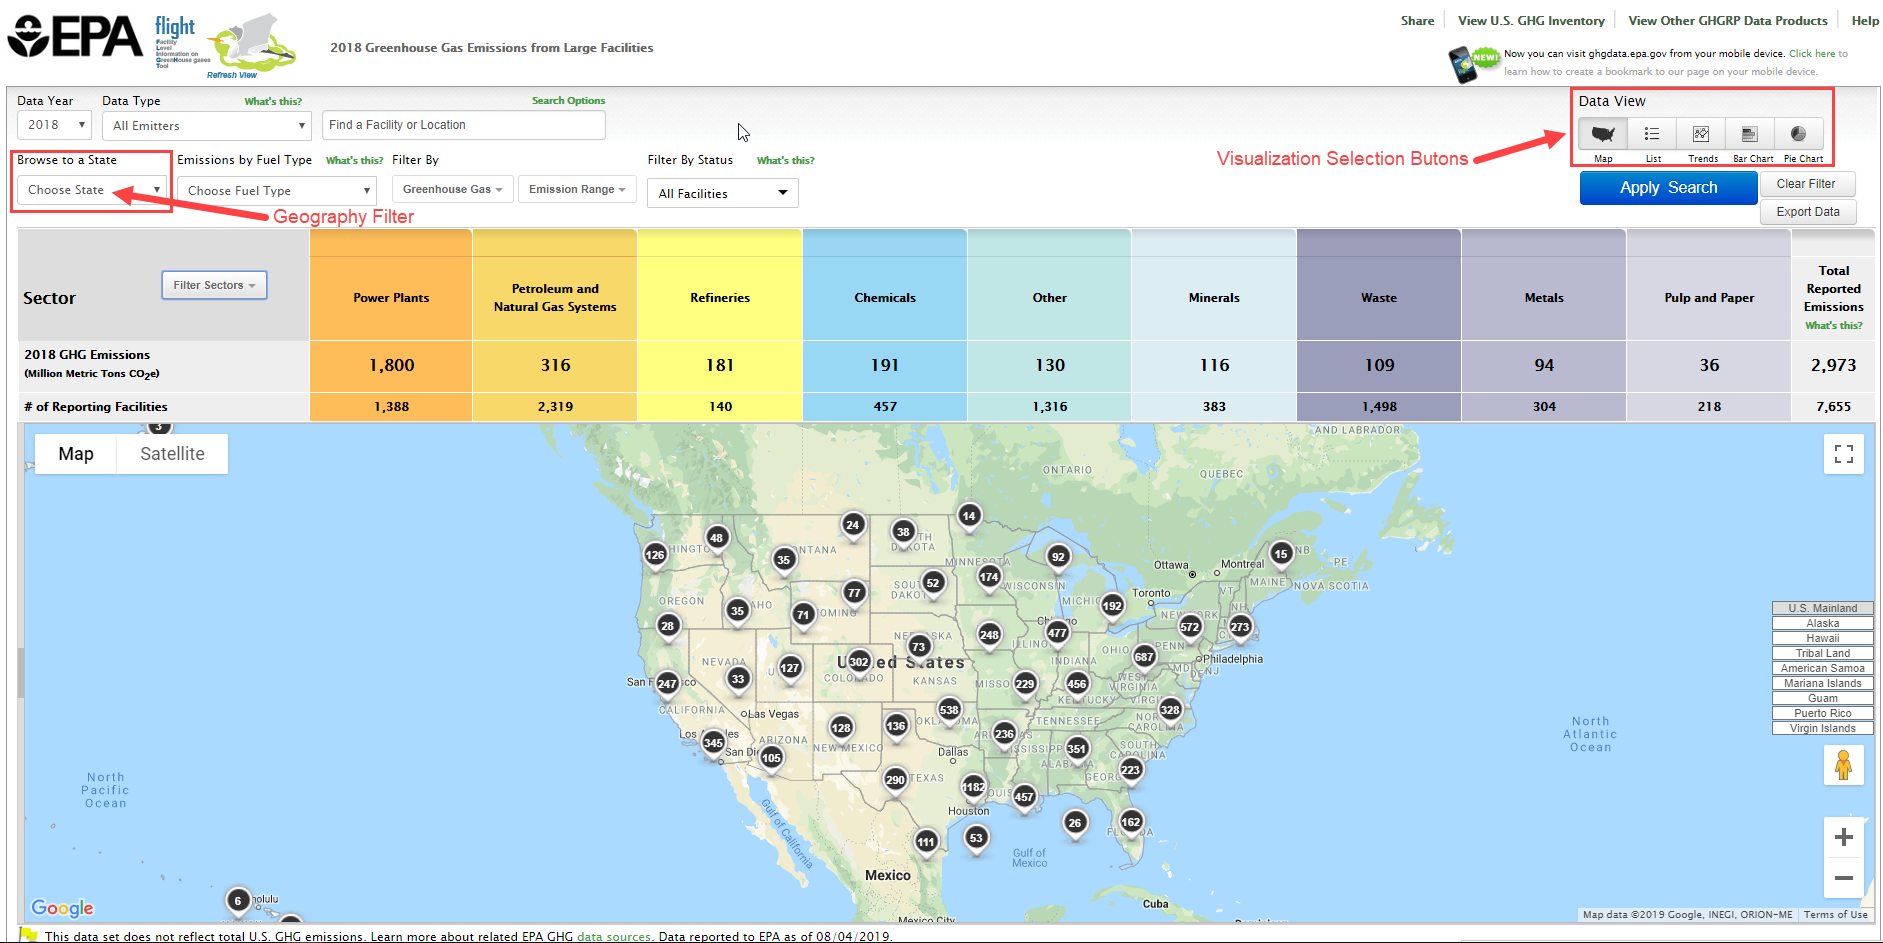 Image Removed
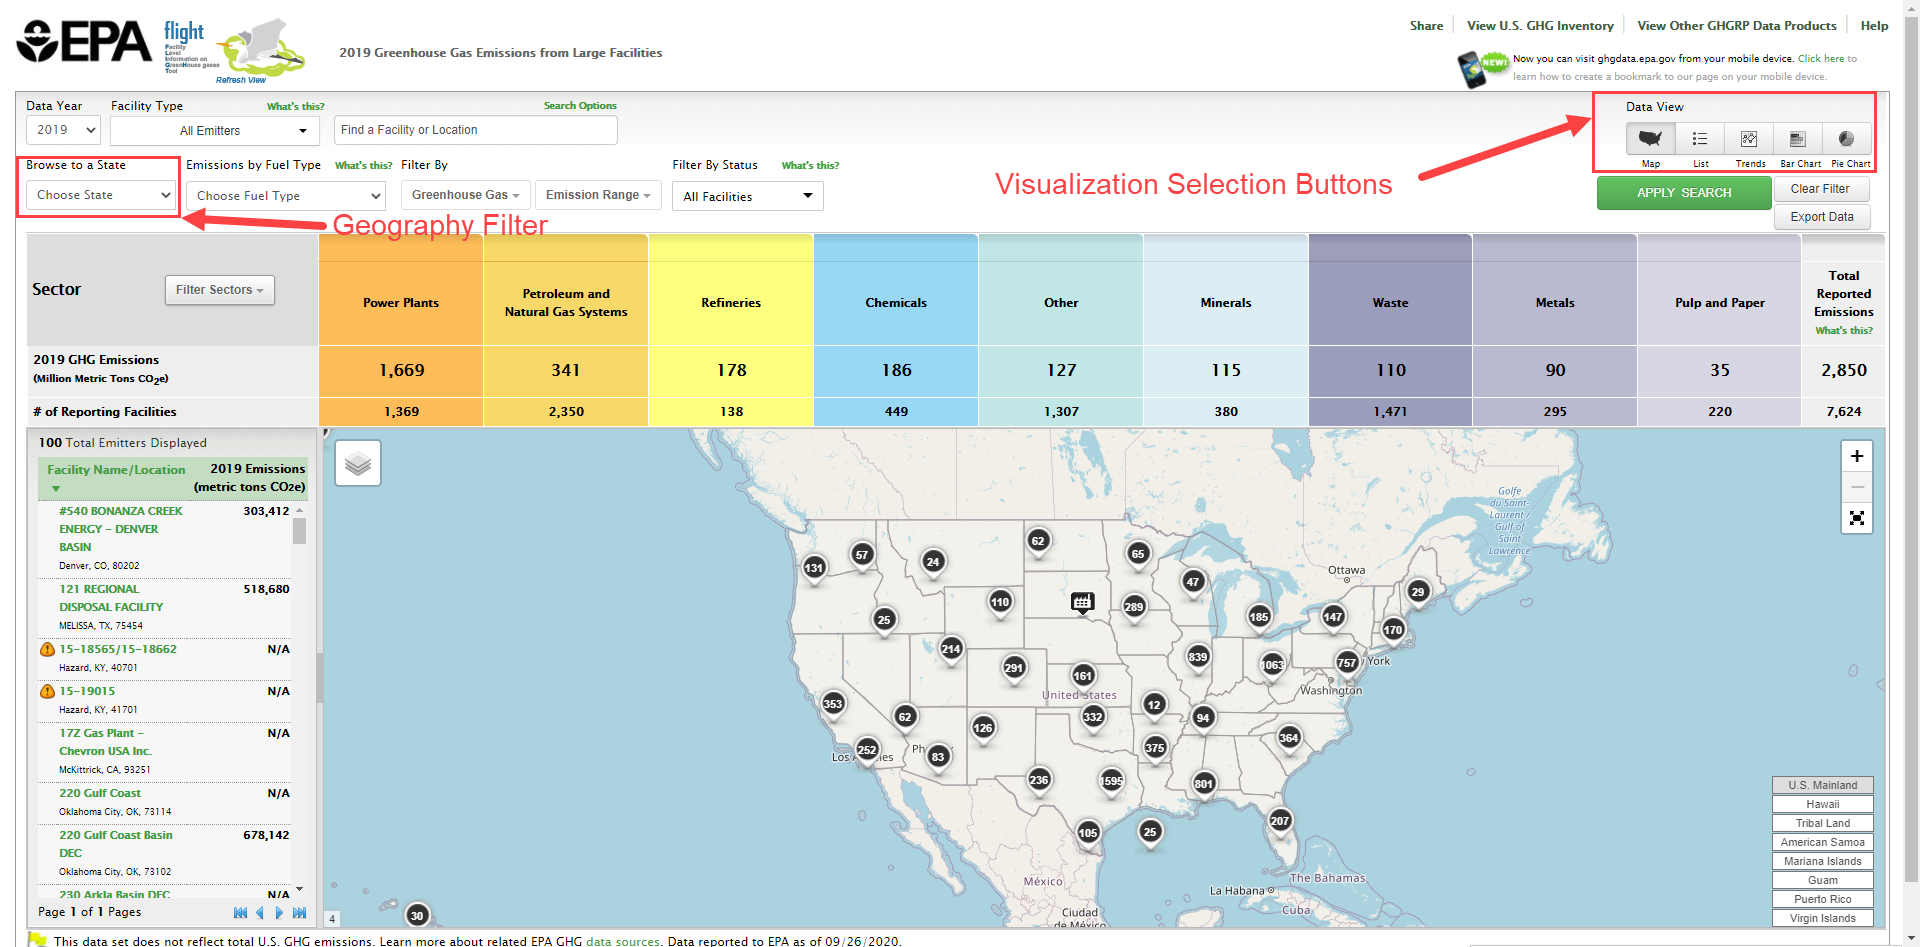 Image Added
| Section |
|---|
| Column |
|---|
| Map
Mouse-over a facility icon on the map to display summary information for that facility and click the icon to show detailed information on that facility. Round black icons on the map represent multiple facilities in close proximity to each other. The number in the center of each black icon represents the count of facilities in that area. Click the buttons in the lower right of the map to quickly find areas outside the continental US, such as Alaska, Hawaii or Puerto Rico. Click image to expand below
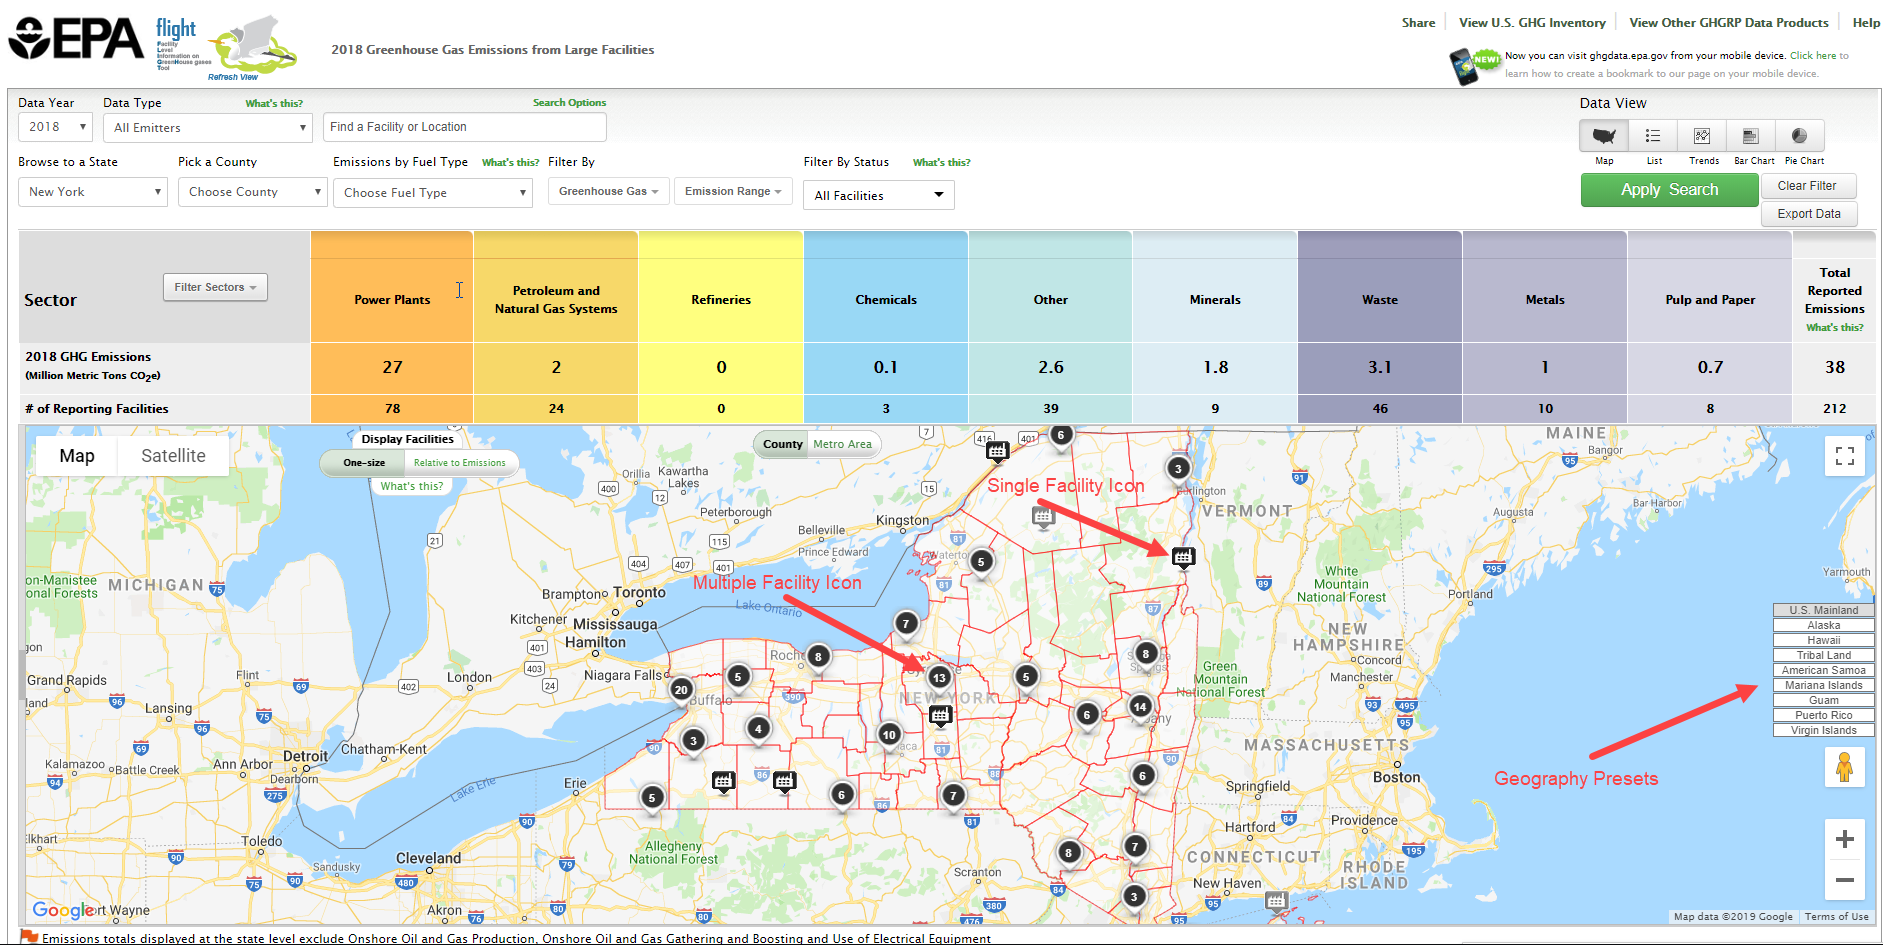 Image Removed Image Removed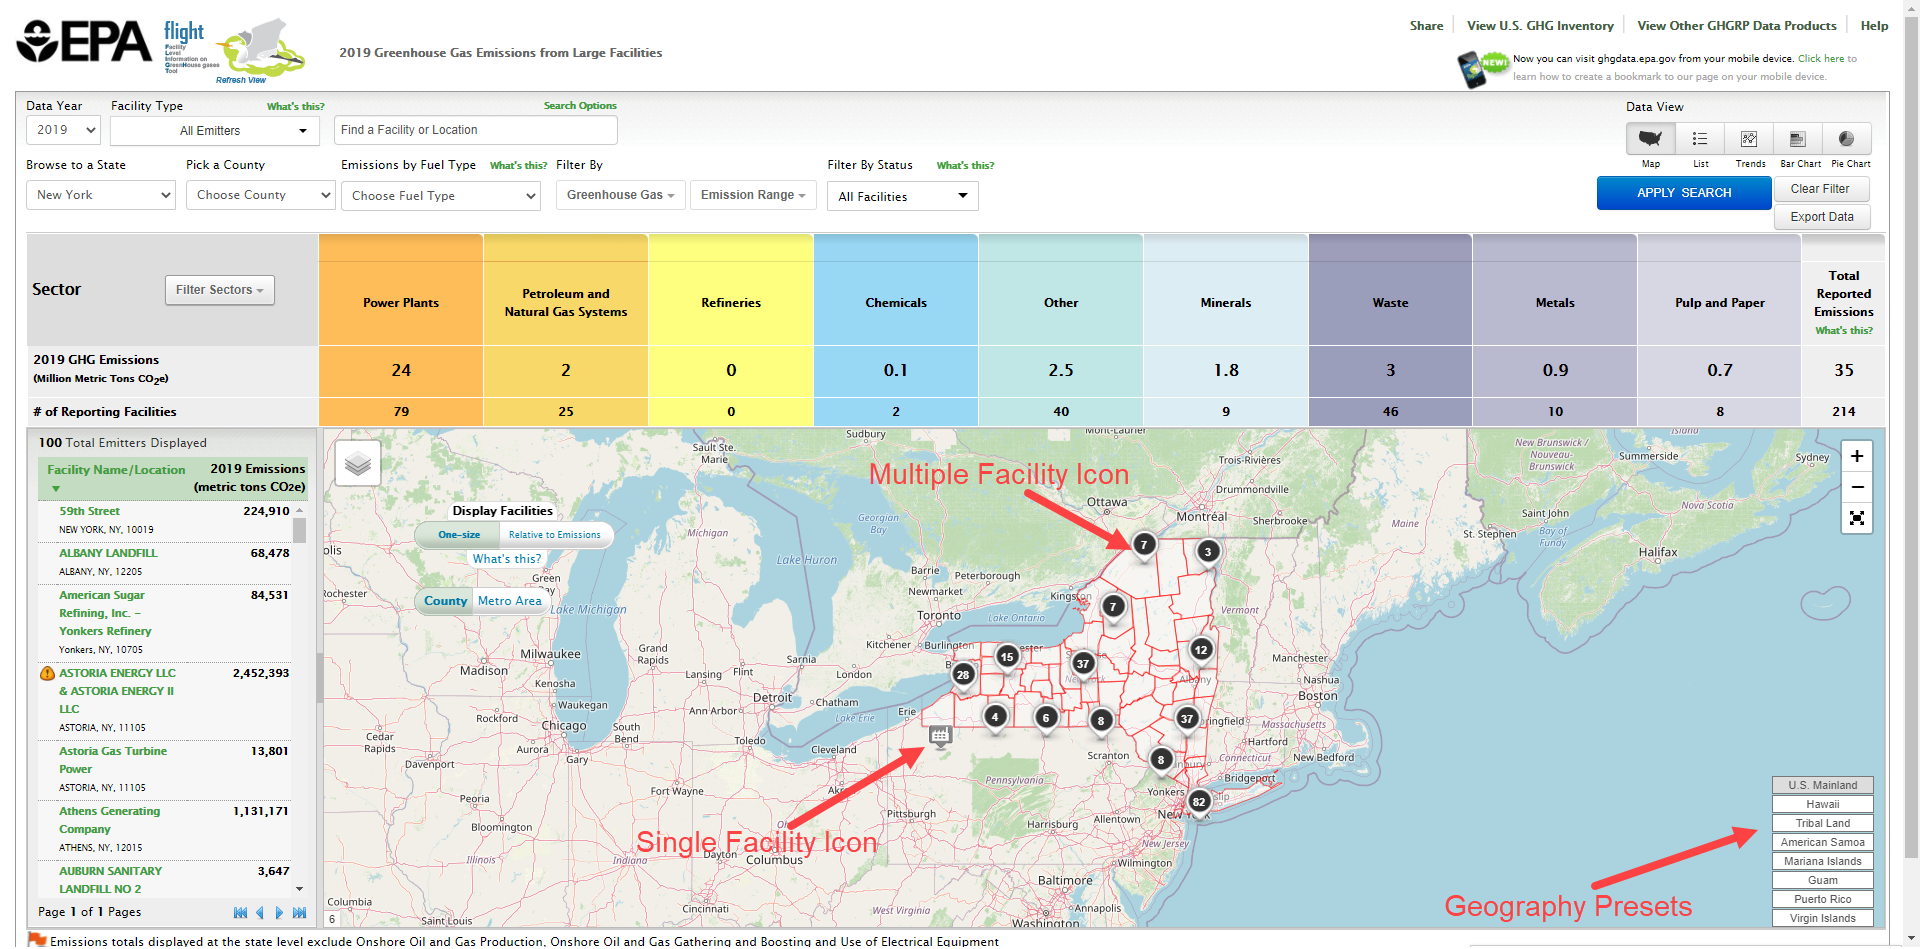 Image Added Image Added
List
Data lists may be organized by geography (sectors within states/counties), by facility in the current year, or by changes in facility emissions across multiple years. Use the toggle buttons above the visualization window to reorganize the data and click the column headers to sort.
| Center |
|---|
| Facility List Geography |
|
|---|
Click image to expand below 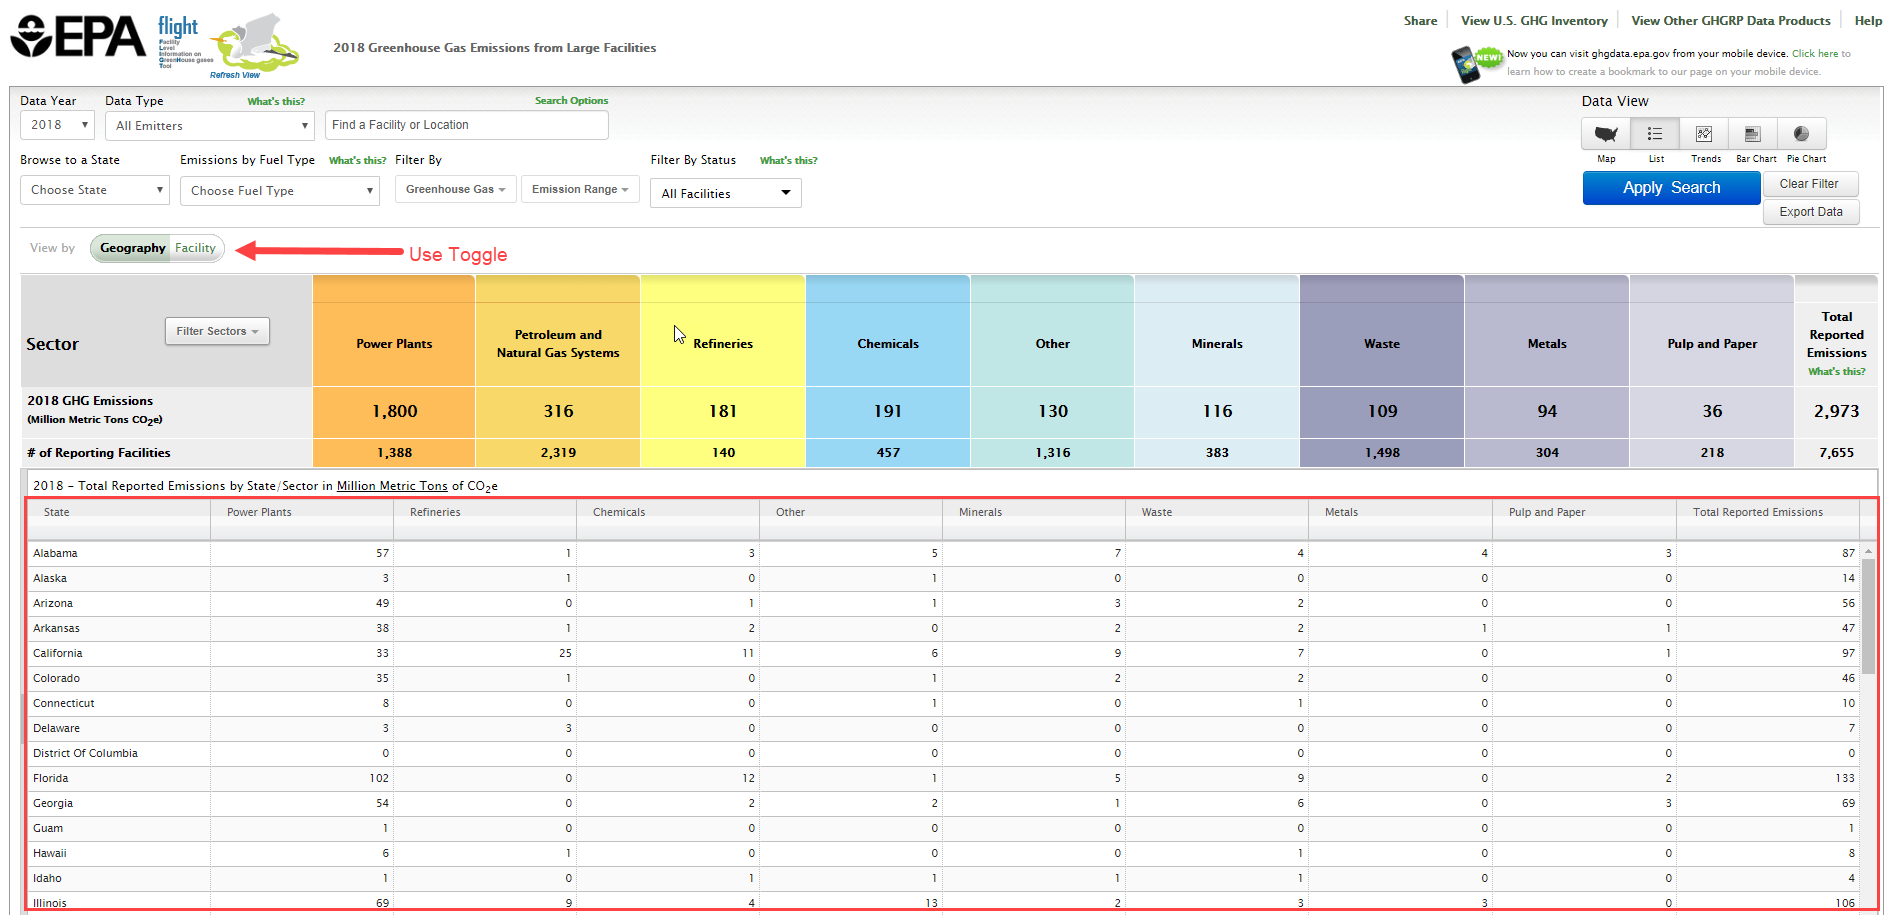 |
| Center |
|---|
| Facility List Current Year |
|
|---|
Click image to expand below 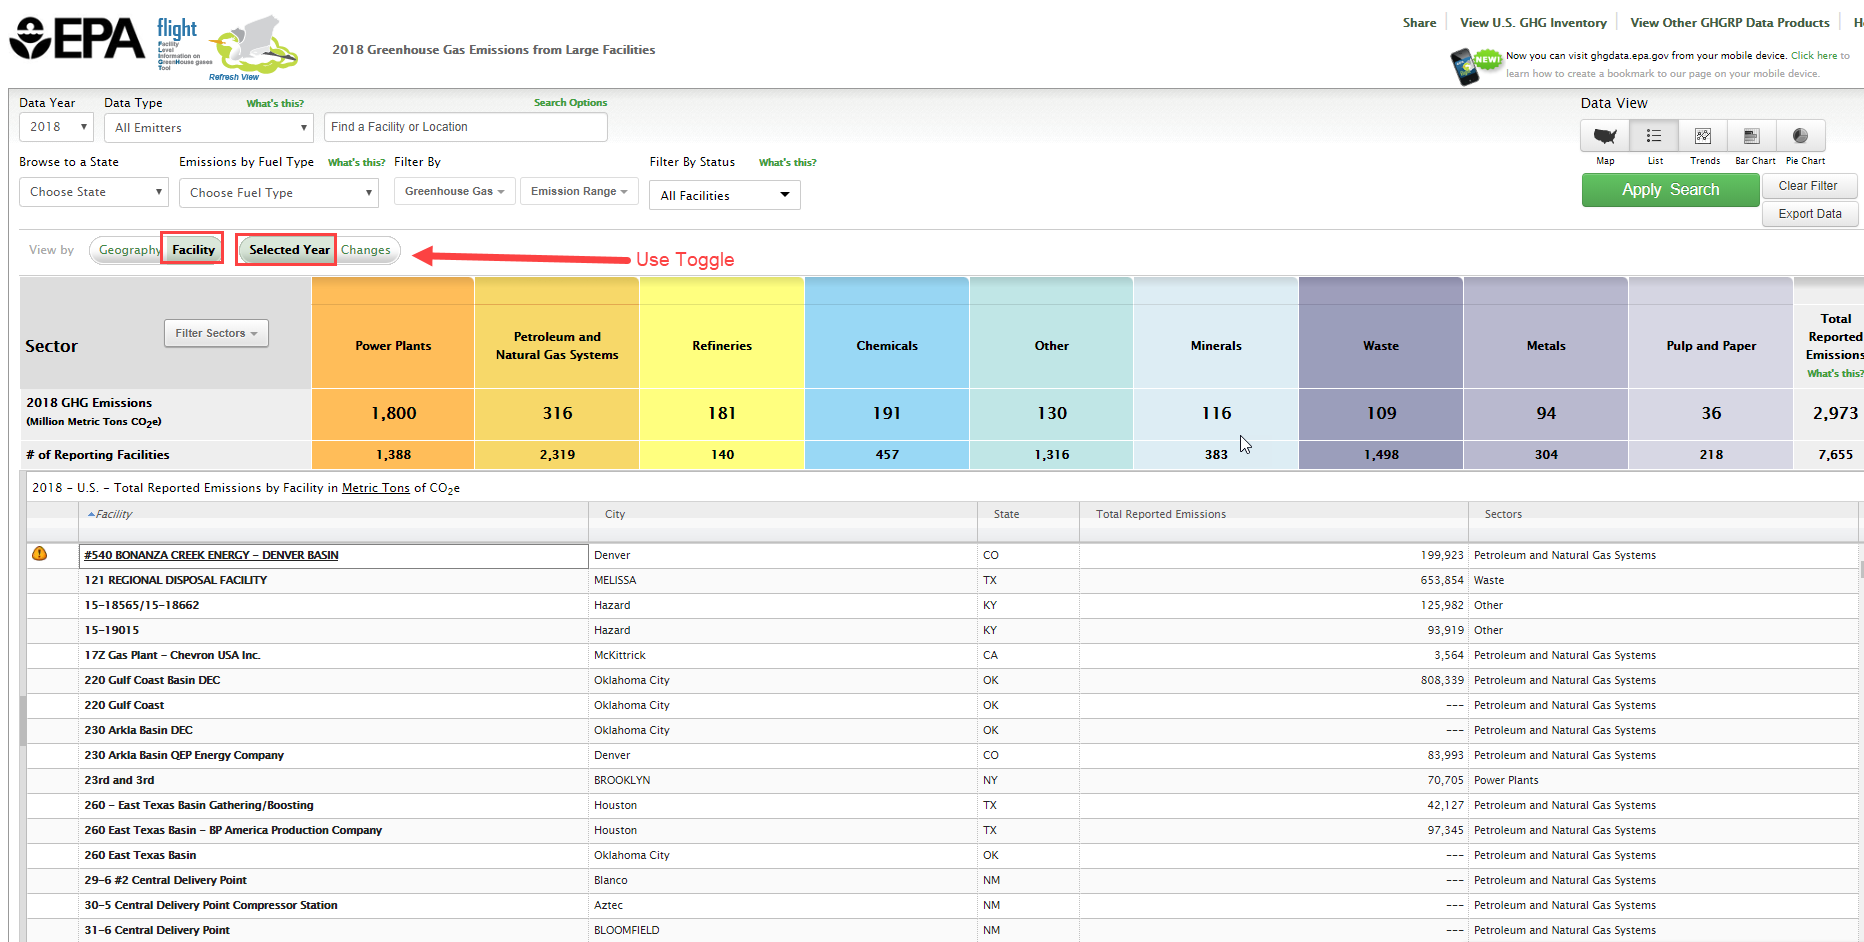 |
| Center |
|---|
| Facility List Changes |
|
|---|
Click image to expand below 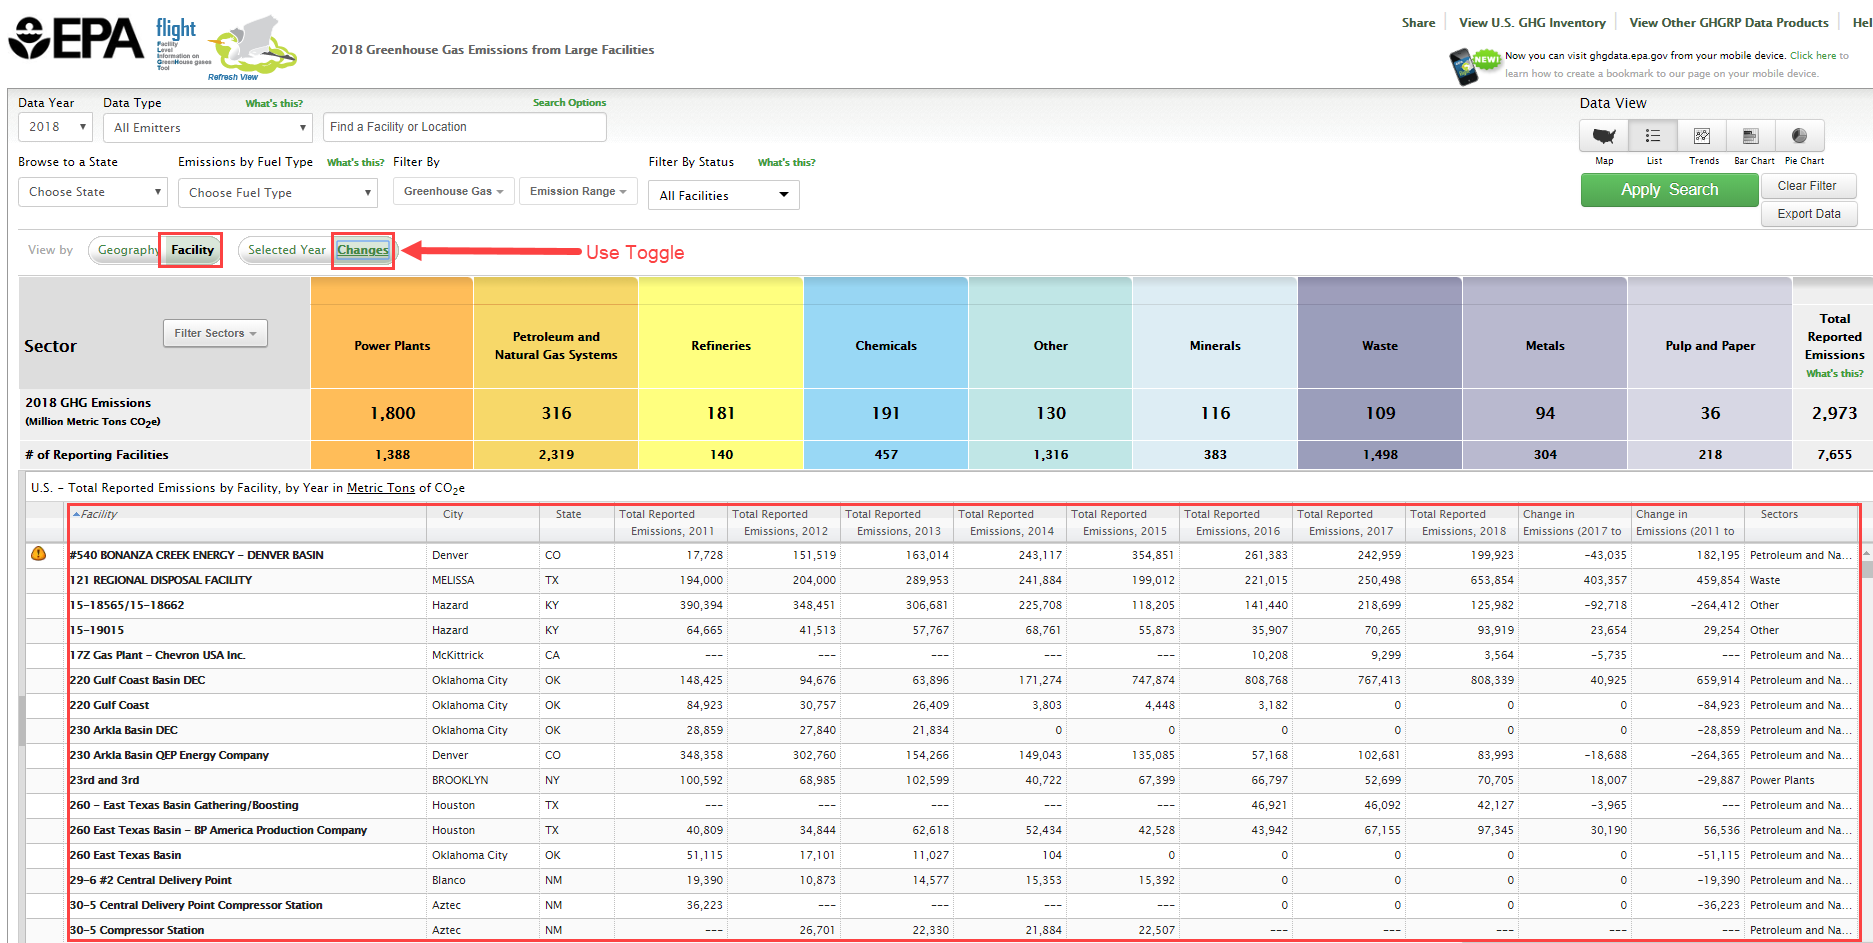 |
Charts
Users may view the data in three chart formats: bar chart, pie chart, or line chart. Use the toggle buttons above the visualization window to change chart type. |
|---|
Click image to expand below 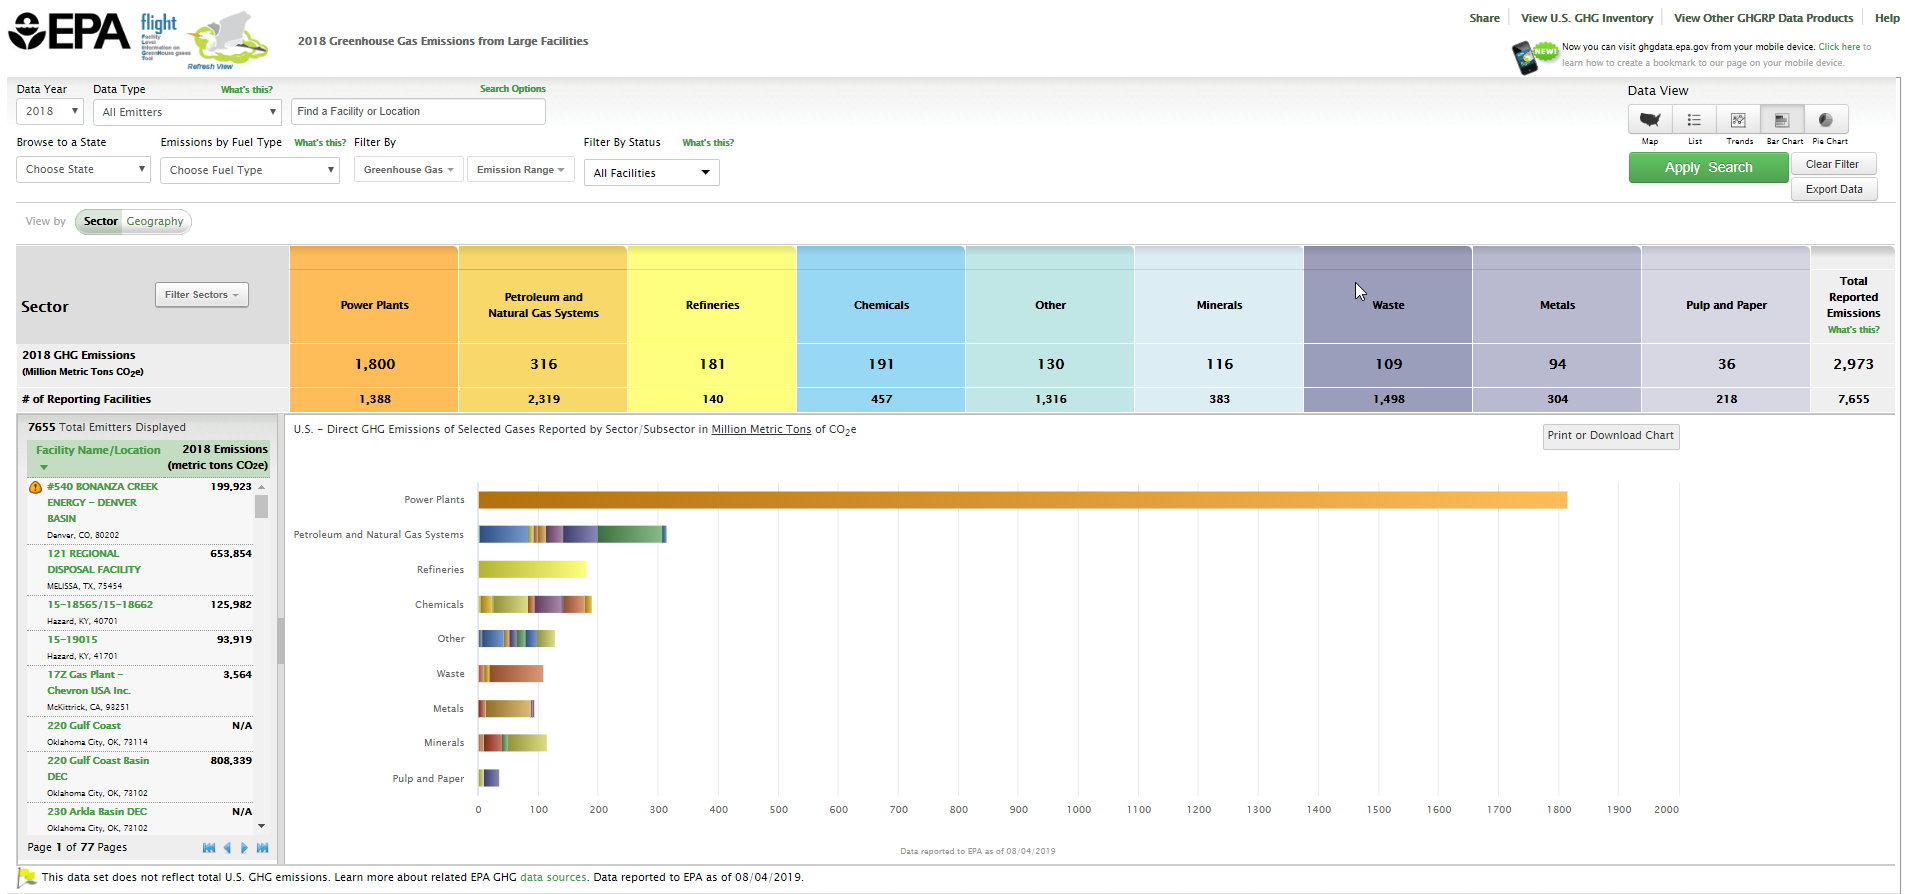 |
|
|---|
Click image to expand below 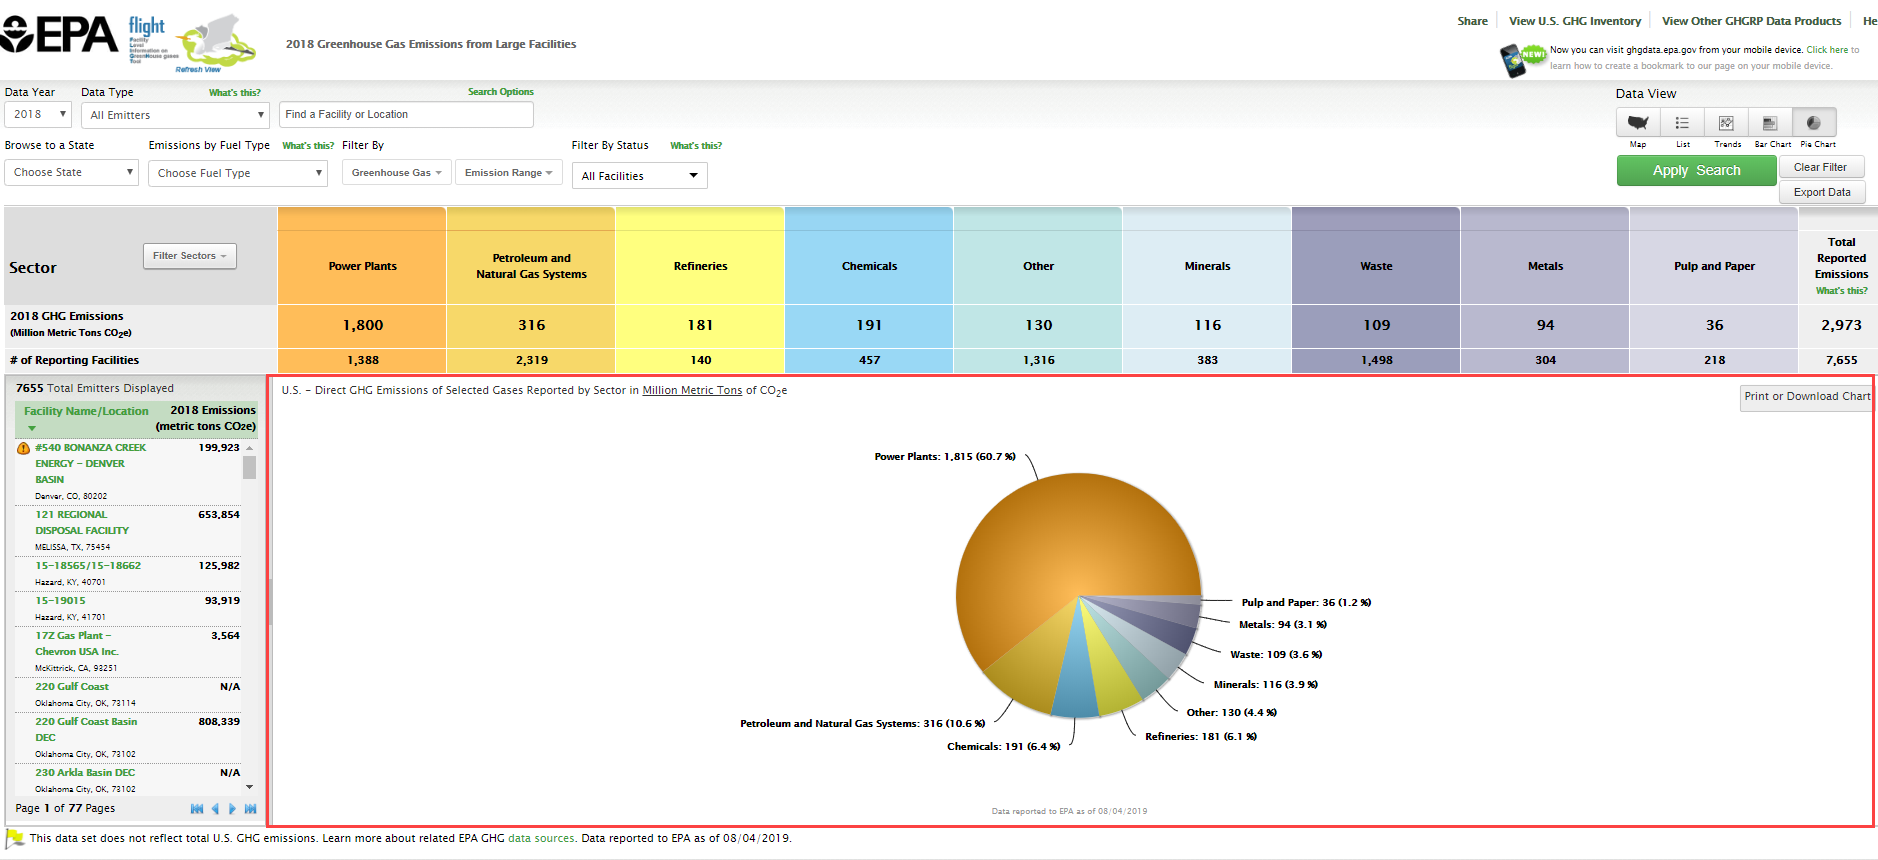 |
|
|---|
Click image to expand below 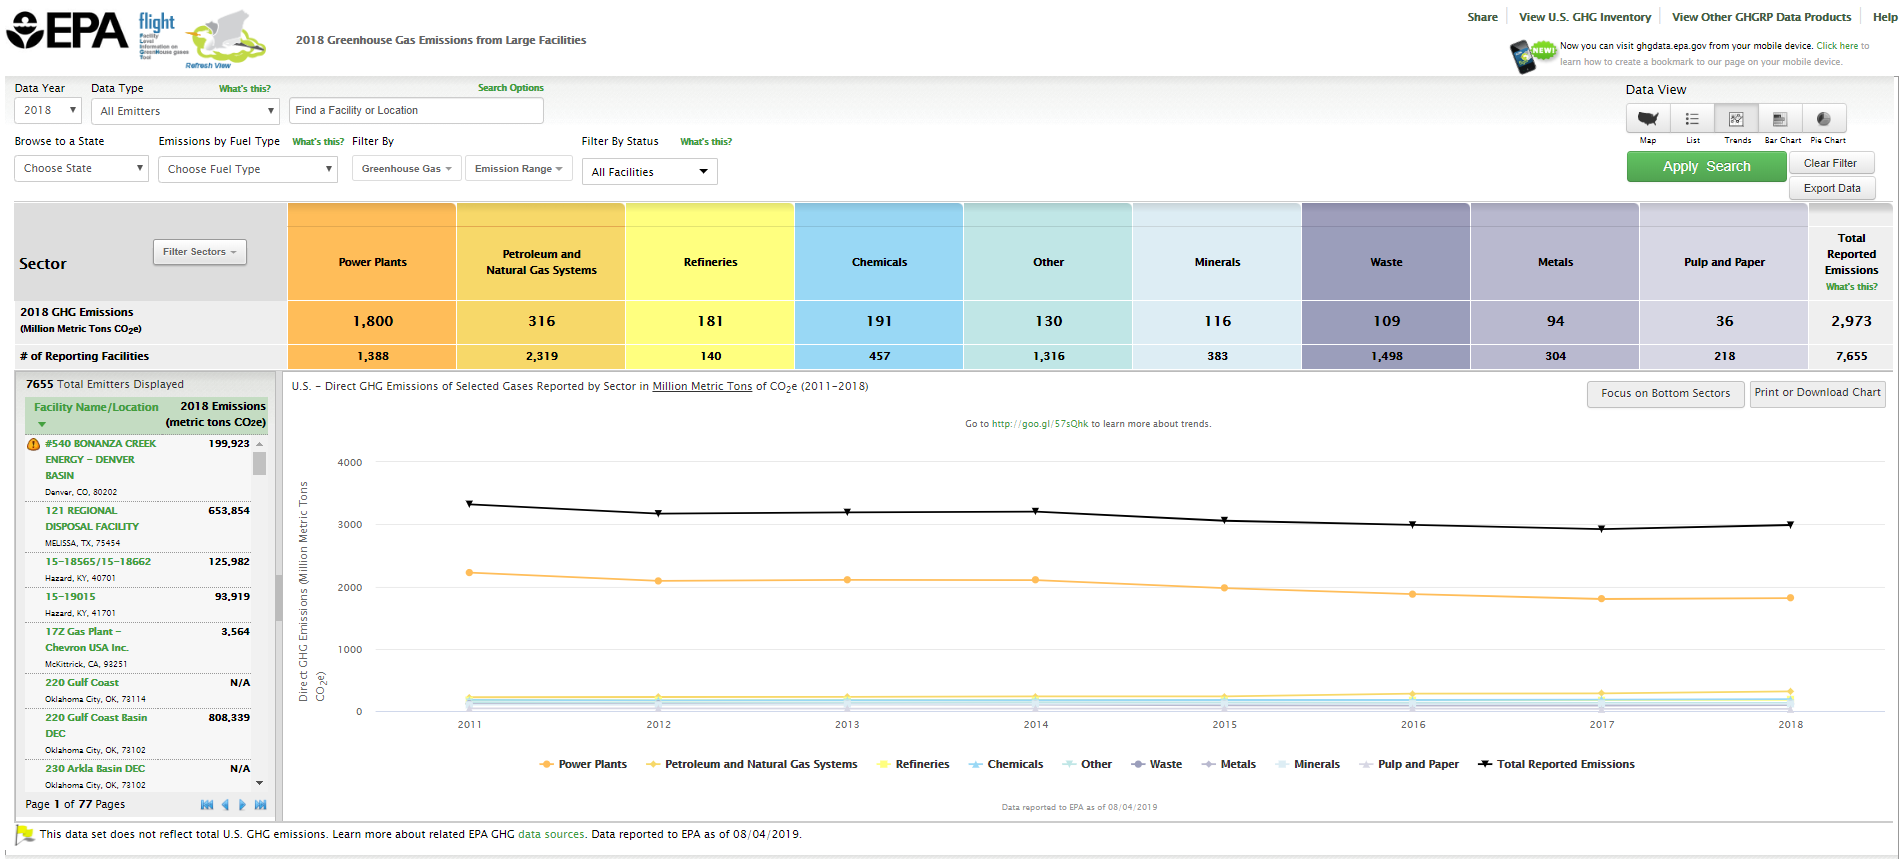 |
|
|
...