These optional spreadsheets are provided to assist reporters in calculating emissions and in keeping records of these calculations.
Reporters are required to keep records of these calculations under 40 CFR 98.3(g) and additional subpart-specific provisions, but are not required to use these spreadsheets or to submit any spreadsheets to EPA.
Overview
This help page provides guidance for working with the supplemental Subpart E Calculation Spreadsheets. The guidance provides step-by-step instructions for the following tasks:
- Downloading the Calculation Spreadsheet
- General Information on Using a Calculation Spreadsheet
- Using the Equation E-2 Calculation Spreadsheet
- Using the Equation E-3a Calculation Spreadsheet
- Using the Equation E-3b Calculation Spreadsheet
- Using the Equation E-3c Calculation Spreadsheet
The calculation spreadsheets for Subpart E may be downloaded by clicking the link in the first column of the table below. Users may also jump to instructions for each calculation spreadsheet by clicking the link in the second column.
Calculation Spreadsheet | Instructions |
|---|---|
| Equation E-3a Calculation Spreadsheet.xls | E-3a Help |
| Equation E-3b Calculation Spreadsheet.xls | E-3b Help |
| Equation E-3c Calculation Spreadsheet.xls | E-3c Help |
The guidance provided in this section applies to calculation spreadsheets for all subparts. Additional guidance specific to Subpart E is provided in the following section.
Color coding
The calculation spreadsheets contain green input cells, gray informational cells, and red-bordered results cells filled with yellow or white. Users should use green input cells to enter all data specific to their facility, unit, or process. Gray informational cells contain parameter names, column and row headings, equation constants and subtotals. Calculation results are displayed in red-bordered results cells filled with yellow or white. For red-bordered, yellow-filled results cells, the values in these cells should be entered in the appropriate and separate calculation spreadsheet (as directed below cell) where additional calculations will be made. For red-bordered, white filled results cells, the values in these cells should be entered in e-GGRT for the appropriate process units. All cells that are not green input cells are locked and cannot be modified.
|
Green input cell (data entry) |
|
Gray informational cells (locked) |
|
Red-bordered, yellow-filled results cells (enter in appropriate and separate calculation spreadsheet) |
|
Red-bordered, white filled results cells (enter in e-GGRT) |


Stop and Warning Messages
The calculation spreadsheets will display a stop message if the user enters a value that is invalid or a warning message if the user enters a value outside the EPA estimated range for a particular data element. For invalid data entries, the stop messages will not allow a user to proceed and the user must reenter valid data before moving forward. For data entries that are outside the EPA estimated range for a particular data element, the warning messages will allow a user to proceed if the user deems the entered value to be accurate.
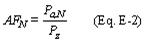
Use the Equation E-2 Calculation Spreadsheet to calculate the abatement factor for N2O emissions for each abatement technology used by the unit. A separate spreadsheet is to be used for each unit. Users should not use aggregated data from multiple units in a single calculation spreadsheet. The Equation E-2 Calculation Spreadsheet performs the calculations using Equation E-2 provided below (see calculation spreadsheet for definitions of variables).
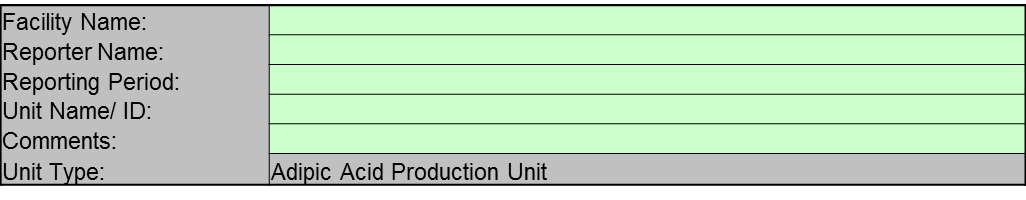
Begin by entering the facility name, your name, the unit name or identifier, the reporting period and any additional comments in the green input cells of the General Information table located immediately below the equations in the calculation spreadsheet. This is for your records.
Next, enter the requested information in the green input cells of the input data table.
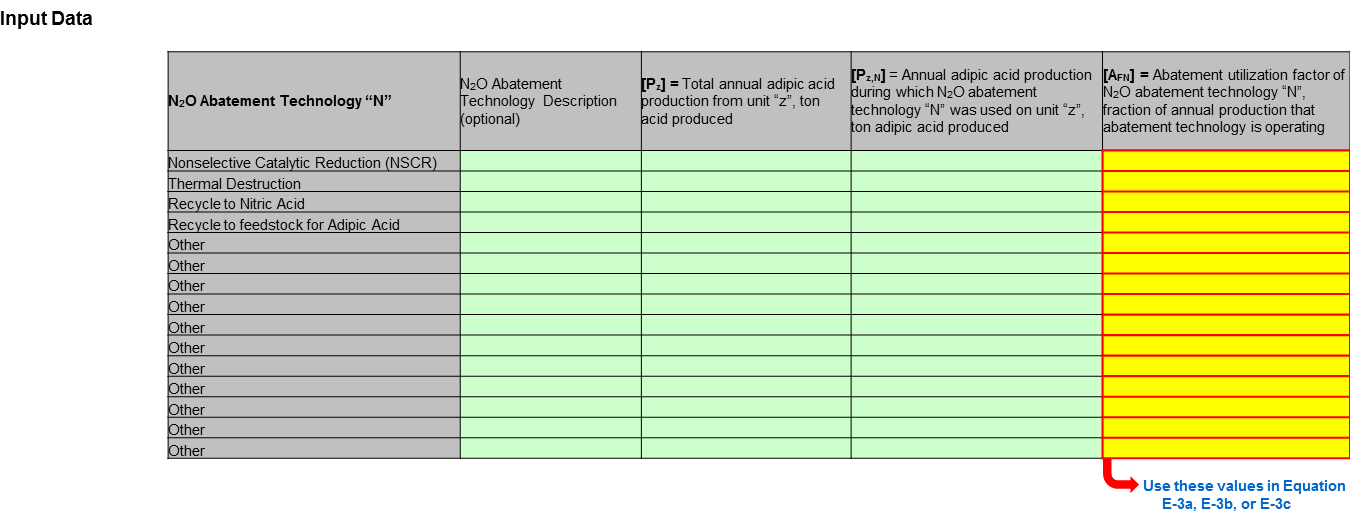
The calculation spreadsheet will then calculate the abatement utilization factor for each N2O abatement technology associated with this adipic acid production unit. The calculated values will be displayed in red-bordered cells in the column on the far right of the Data Input table. These values should be entered in the applicable calculation spreadsheet for Equation E-3a, Equation E-3b or Equation E-3c.
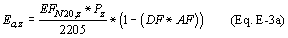
Use the Equation E-3a Calculation Spreadsheet to calculate annual N2O mass emissions for a unit where a single N2O abatement technology "N" is located after your test point. A separate spreadsheet is to be used for each unit. Users should not use aggregated data from multiple units in a single calculation spreadsheet. The Equation E-3a Calculation Spreadsheet performs the calculations using Equation E-3a provided below (see calculation spreadsheet for definitions of variables).
Begin by entering the facility name, your name, the unit name or identifier, the reporting period and any additional comments in the green input cells of the General Information table located immediately below the equations in the calculation spreadsheet. This is for your records.
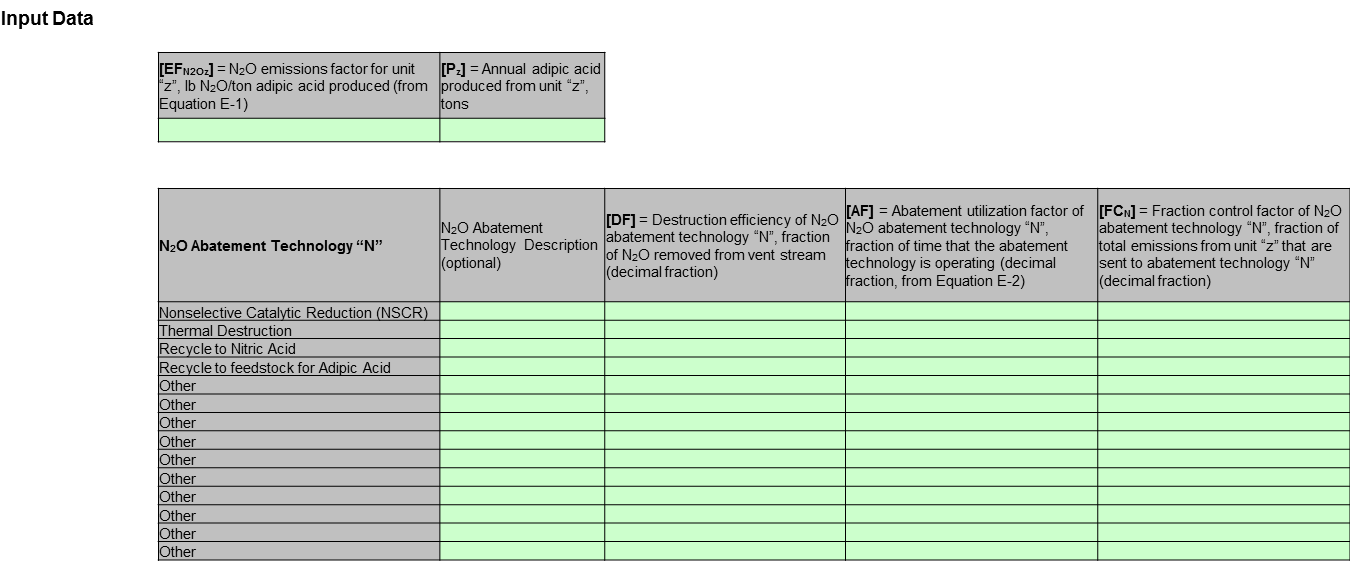
Next, enter the requested information in the green input cells of the input data table.

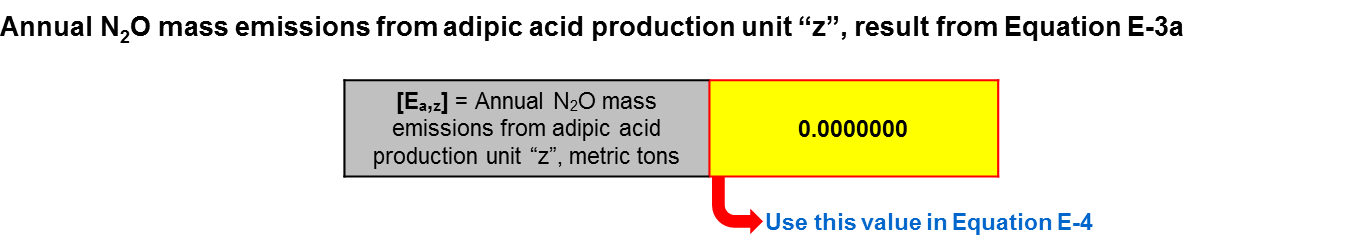
The calculation spreadsheet will then calculate the annual N2O mass emissions for this adipic acid production unit. The calculated values will be displayed in the red-bordered cell in the annual N2O mass emissions table. This value should be used in Equation E-4 to calculate total annual N2O emissions for the facility.
Use the Equation E-3b Calculation Spreadsheet to calculate annual N2O mass emissions for a unit where a multiple N2O abatement technologies are located in series after your test point. A separate spreadsheet is to be used for each unit. Users should not use aggregated data from multiple units in a single calculation spreadsheet. The Equation E-3b Calculation Spreadsheet performs the calculations using Equation E-3b provided below (see calculation spreadsheet for definitions of variables).

Begin by entering the facility name, your name, the unit name or identifier, the reporting period and any additional comments in the green input cells of the General Information table located immediately below the equations in the calculation spreadsheet. This is for your records.
Next, enter the requested information in the green input cells of the input data table.
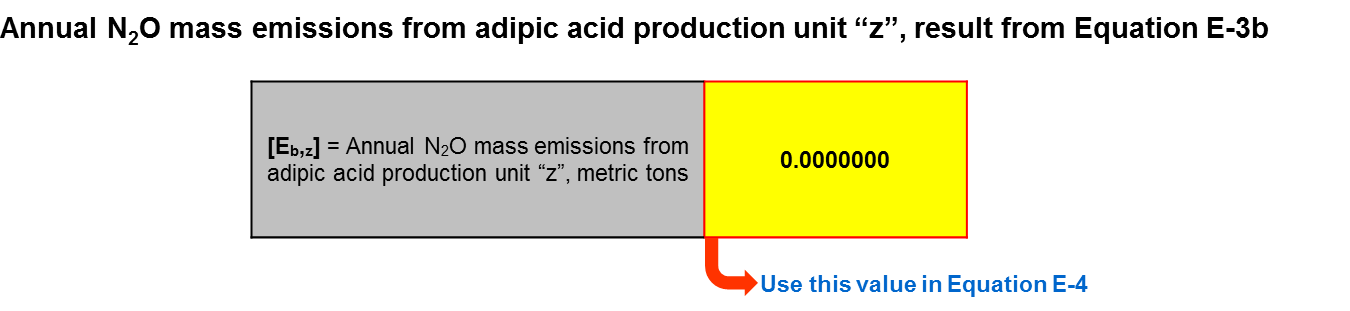
The calculation spreadsheet will then calculate the annual N2O mass emissions for this adipic acid production unit. The calculated values will be displayed in the red-bordered cell in the annual N2O mass emissions table. This value should be used in Equation E-4 to calculate total annual N2O emissions for the facility.
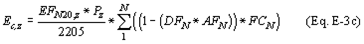
Use the Equation E-3c Calculation Spreadsheet to calculate annual N2O mass emissions for a unit where a multiple N2O abatement technologies are located in parallel after your test point. A separate spreadsheet is to be used for each unit. Users should not use aggregated data from multiple units in a single calculation spreadsheet. The Equation E-3c Calculation Spreadsheet performs the calculations using Equation E-3c provided below (see calculation spreadsheet for definitions of variables).
Begin by entering the facility name, your name, the unit name or identifier, the reporting period and any additional comments in the green input cells of the General Information table located immediately below the equations in the calculation spreadsheet. This is for your records.
Next, enter the requested information in the green input cells of the input data tables.
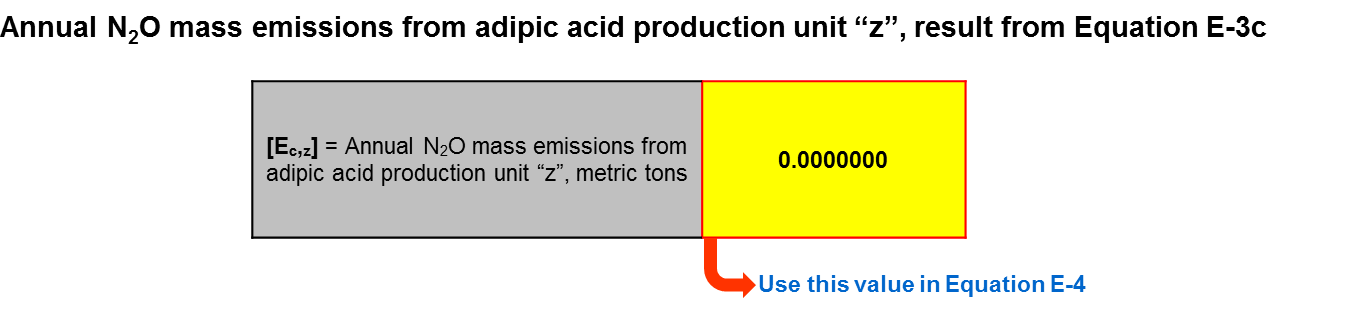
The calculation spreadsheet will then calculate the annual N2O mass emissions for this adipic acid production unit. The calculated values will be displayed in the red-bordered cell in the annual N2O mass emissions table. This value should be used in Equation E-4 to calculate total annual N2O emissions for the facility.